4. Graphing Trigonometric Functions
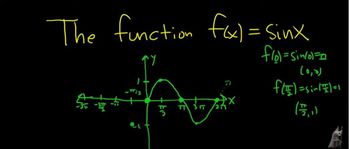
Graphs of the Sine and Cosine Functions
Problem 35d
Textbook Question
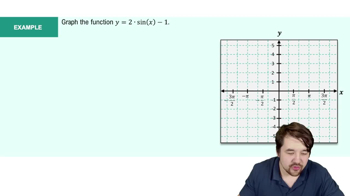
Textbook QuestionIn Exercises 35–42, determine the amplitude and period of each function. Then graph one period of the function. y = cos 2x
 Verified Solution
This video solution was recommended by our tutors as helpful for the problem above
Video duration:
8mWas this helpful?
Key Concepts
Here are the essential concepts you must grasp in order to answer the question correctly.
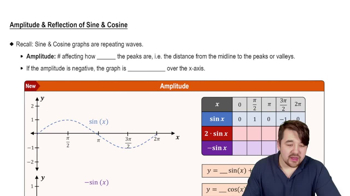
Amplitude
Amplitude refers to the maximum height of a wave from its central axis. In trigonometric functions like cosine, it indicates how far the function reaches above and below its midline. For the function y = cos(2x), the amplitude is 1, as the cosine function oscillates between -1 and 1.
Recommended video:
 5:05
5:05Amplitude and Reflection of Sine and Cosine
Period
The period of a trigonometric function is the length of one complete cycle of the wave. For the cosine function, the standard period is 2π. However, when the function is modified, such as in y = cos(2x), the period is adjusted by the coefficient of x, resulting in a new period of π, meaning the function completes one full cycle in that interval.
Recommended video:
 5:33
5:33Period of Sine and Cosine Functions
Graphing Trigonometric Functions
Graphing trigonometric functions involves plotting the values of the function over a specified interval. For y = cos(2x), one period can be graphed from 0 to π, showing the characteristic wave shape. Understanding the amplitude and period is crucial for accurately representing the function's behavior on a graph.
Recommended video:
 6:04
6:04Introduction to Trigonometric Functions
 5:53m
5:53mWatch next
Master Graph of Sine and Cosine Function with a bite sized video explanation from Nick Kaneko
Start learningRelated Videos
Related Practice