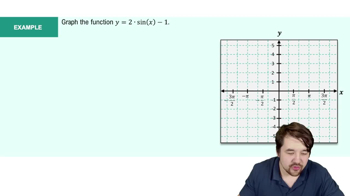
Hey, everyone. Let's see how we can solve this example. So in this problem, we're asked to graph the function \( y \) is equal to the sine of \( x \) plus 3 on the graph below. Now in order to solve this problem, I always like to start off by graphing what I'm already familiar with. And something that I'm familiar with is what the graph \( y \) is equal to the sine of \( x \) is going to look like. So I'm going to go ahead and ignore this plus 3 for now and just graph this sine of \( x \), because we can incorporate this plus 3 later.
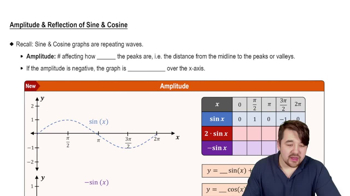
So recall that the sine of \( x \) graph is a value that starts at the center, and what you can do is going to the right; this is going to be a wave. Now our wave is going to reach a peak at \( \frac{\pi}{2} \), and then we're going to cross down here through \( \pi \), and we're going to reach a valley at \( \frac{3\pi}{2} \), and keep waving as we go to the right. Now notice that the peak is at positive one, and the valley is at negative one for the 2 outputs on the \( y \)-axis.
Now we can continue this wave going back on our graph as well. So going to reach a valley as we get to negative \( \frac{\pi}{2} \), and we're going to come and cross through negative \( \pi \). We're going to reach a peak at \( \frac{3\pi}{2} \), and then this graph will keep waving. So this is what the sine of \( x \) graph is going to look like.
Now in order to graph this function, which is \( y \) is equal to the sine of \( x \) plus 3, what I can recognize is that we have a number being added to our sine of \( x \). This is going to cause a shift. And because we have a positive number, this graph is going to shift up by 3 units. So what that means is I can take every point and shift it up by 3. So the point that we had that started at the center is now going to be up here at a value of 3. That's gonna be our coordinate there. So we're gonna be 3 units up for where our graph starts, then this peak here is going to be 3 units up as well, which is gonna be at positive 4. This 0 point that we have at \( \pi \), this is going to be 3 units up, so it's going to also be at 3, and then this valley that we have at negative one is going to be up 3 units at positive 2.
So that's what the graph is going to look like as we go to the right, and this will also be the same as we go to the left. So for negative \( \frac{\pi}{2} \), we're also going to be at positive 2 for our output, and negative \( \pi \) we're at an output of 0, so our output is going to be up here at 3, And then at negative \( \frac{3\pi}{2} \), we can see their output is 1, so that means our output will be up here at 4. So connecting these points, the graph is going to look something like this, where we have this wave-like behavior that goes to the left and right side of this graph.
So this is our sketch for the function \( y \) is equal to the sine of \( x \) plus 3, and that is the solution to this problem. I hope you found this video helpful. Thanks for watching.