
Textbook Question
Determine the amplitude of each function. Then graph the function and y = sin x in the same rectangular coordinate system for 0 ≤ x ≤ 2π. y = 1/3 sin x
807
views
 Verified step by step guidanceVerified video answer for a similar problem:
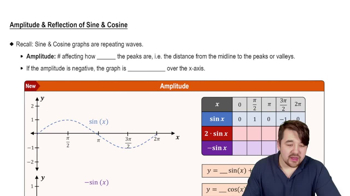
 5:05
5:05 5:53
5:53 6:04
6:04