4. Graphing Trigonometric Functions
Graphs of the Sine and Cosine Functions
Problem 60
Textbook Question
In Exercises 53–60, use a vertical shift to graph one period of the function. y = −3 sin 2πx + 2
 Verified step by step guidance
1
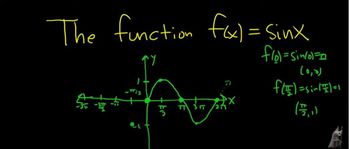
Identify the basic function: The given function is based on the sine function, which is \( y = \sin(x) \).
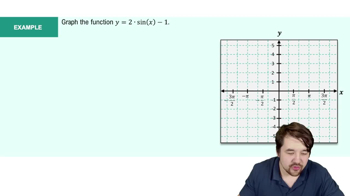
Determine the amplitude: The coefficient of the sine function is \(-3\), which means the amplitude is \(|-3| = 3\). This indicates the graph will stretch vertically by a factor of 3 and be reflected over the x-axis.
Identify the period: The function inside the sine is \(2\pi x\), which affects the period. The period of \(\sin(x)\) is \(2\pi\), so the period of \(\sin(2\pi x)\) is \(\frac{2\pi}{2\pi} = 1\).
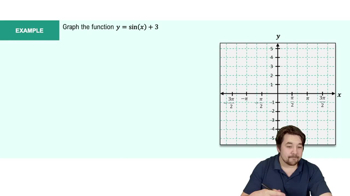
Determine the vertical shift: The function has a vertical shift of \(+2\), which means the entire graph will be shifted up by 2 units.
Graph one period: Start by plotting the key points of the sine function over one period \([0, 1]\), apply the amplitude and reflection, then shift the graph up by 2 units to complete the transformation.
Recommended similar problem, with video answer:
Verified SolutionThis video solution was recommended by our tutors as helpful for the problem above
Video duration:
10mWas this helpful?
Key Concepts
Here are the essential concepts you must grasp in order to answer the question correctly.
Sine Function
The sine function is a periodic function that describes the relationship between an angle and the ratio of the opposite side to the hypotenuse in a right triangle. It oscillates between -1 and 1, and its graph is a smooth wave. In the context of the given function, the sine function is modified by amplitude and vertical shifts.
Recommended video:

 5:53
5:53Graph of Sine and Cosine Function
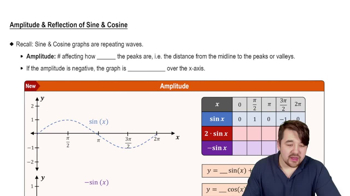
Amplitude
Amplitude refers to the maximum distance the graph of a periodic function reaches from its midline. In the function y = -3 sin 2πx + 2, the amplitude is 3, indicating that the graph will reach 3 units above and below its midline. The negative sign indicates that the graph is reflected over the midline.
Recommended video:
 5:05
5:05Amplitude and Reflection of Sine and Cosine
Vertical Shift
A vertical shift occurs when a constant is added to or subtracted from a function, moving the entire graph up or down. In the function y = -3 sin 2πx + 2, the '+2' indicates a vertical shift of 2 units upward. This shift affects the midline of the sine wave, changing the center of oscillation from y=0 to y=2.
Recommended video:
 6:31
6:31Phase Shifts
 5:53m
5:53mWatch next
Master Graph of Sine and Cosine Function with a bite sized video explanation from Nick Kaneko
Start learningRelated Videos
Related Practice