In this video, we're just going to briefly go over some inferential statistics. So, in psychology, inferential statistics are used to draw conclusions about how statistically reliable a study's results are. Essentially, we are asking, "Can we trust this data, and is the data from this sample truly representative of the population?" Inferential statistics basically show us the probability of getting the observed results, or just getting your results, if there had been no relationship between the variables in your study. Kind of a weird thing to think about, so I'm going to say that one more time.
But inferential statistics show us the probability or the odds of getting our results had there actually been no relationship between the variables in our study. Essentially what we're asking is, "What are the odds of this happening by chance? What are the odds that my results are a total fluke, basically?" And the field-wide standard that psychologists have agreed upon is that if the probability of the event happening by chance, or the probability of you getting these results by chance, is less than 5%, then we would consider your results to be statistically significant. So 5% is the agreed-upon threshold or kind of cutoff value that we use in psychology.
And to be clear, this is an arbitrary number. This was just decided on by people one day, but this is the field-wide standard as of right now. So we would write this out using something called a p-value, and the p just stands for probability. So if we're going with this 5%, then we would write this as p<0.05 and that would be considered a statistically significant finding. So you can see on our graph everything here on the left side in green, these are all indicative of significant p-values.
A p-value of 0.05 is significant, a p-value of 0.01 is significant, so this would indicate that there is basically a 1% chance of us getting these results completely by chance. A p-value of 0.001 is significant as well. And basically, what's happening is, the smaller this number gets, the more confident we can be in our results. As that probability gets smaller and smaller, we can really trust that these results probably do exist in the real world. You can see over here everything in gray would be indicative of non-significant p-values.
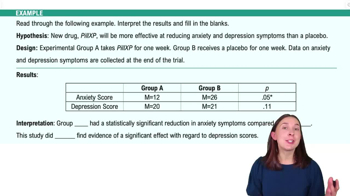
Okay, so if our p-value is greater than 0.05 that would be considered a non-significant result, or you could say like we did not find evidence of a statistically significant result in that case. Alright? So, basically, a big takeaway here when you go out to read research, make sure that you are seeing if a p-value is being described, always be on the lookout for those p-values being less than 0.05. Again and again, these are really common anchors that you'll see; 0.05, 0.01, and 0.001 are probably used most commonly in research.
So, just keep an eye out for these numbers and those would indicate that you are seeing statistically significant findings. Alright. That's our little introduction into inferential statistics. See you guys in the next one. Bye.