When analyzing rational functions, understanding asymptotes is crucial for accurately graphing these functions. Asymptotes are lines that the graph approaches but never touches, providing insight into the function's behavior at extreme values. For instance, consider the rational function \( f(x) = \frac{1}{x} \). This function exhibits both horizontal and vertical asymptotes.
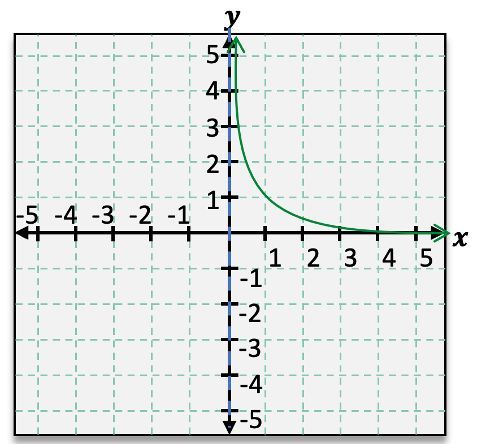
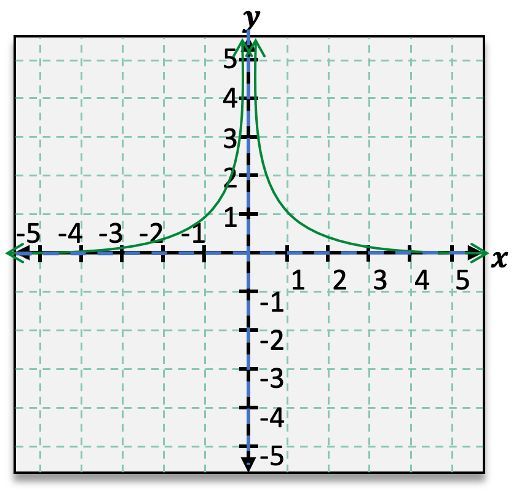
To identify the horizontal asymptote, we observe the behavior of the function as \( x \) approaches infinity or negative infinity. In this case, as \( x \) approaches either infinity, \( f(x) \) approaches 0, indicating a horizontal asymptote at \( y = 0 \). This can be expressed using limit notation: as \( x \to \infty \), \( f(x) \to 0 \) and as \( x \to -\infty \), \( f(x) \to 0 \).
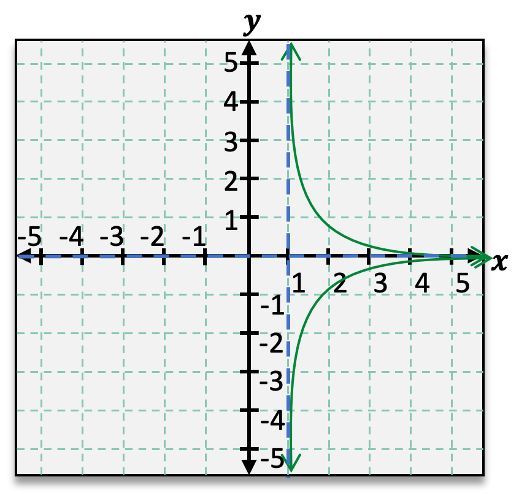
Next, we examine the vertical asymptote, which occurs where the function is undefined. For \( f(x) = \frac{1}{x} \), the function is undefined at \( x = 0 \). As \( x \) approaches 0 from the right, \( f(x) \) increases without bound, approaching positive infinity. Conversely, as \( x \) approaches 0 from the left, \( f(x) \) decreases without bound, approaching negative infinity. This behavior can be denoted as follows: as \( x \to 0^+ \), \( f(x) \to \infty \) and as \( x \to 0^- \), \( f(x) \to -\infty \).
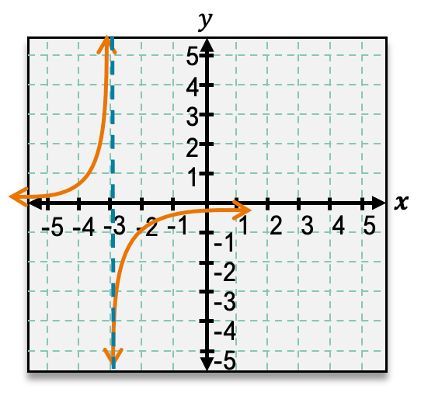
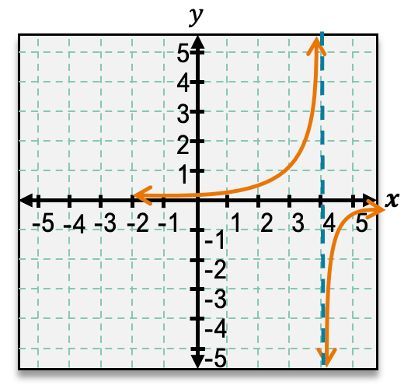
Rational functions can exhibit various configurations of asymptotes. Some may have no asymptotes, while others can have one or multiple vertical and horizontal asymptotes. The presence and location of these asymptotes depend on the specific function being analyzed. For example, a function may have a vertical asymptote at \( x = a \) and a horizontal asymptote at \( y = b \), which can be represented graphically with dashed lines to indicate that the graph approaches these lines but does not intersect them.
In summary, understanding asymptotes is essential for graphing rational functions. By identifying horizontal and vertical asymptotes, one can predict the end behavior of the function and accurately represent its graph. This foundational knowledge is vital for further exploration of rational functions and their properties.