Probability is something that we deal with every single day without realizing it. Whenever we open our weather app to check for the chance of rain or when we consider the possibility of winning the lottery, we're really dealing with probability. But probability isn't just something that we can think about or consider, it's something that we can actually calculate. Now I know this might not be the best news for you knowing that you have another thing to calculate, but you don't have to worry because here I'm going to walk you through the basics of calculating probability and some of the notation that goes along with that. So let's go ahead and get started. Now when working with probability mathematically, we consider the probability of different events and we write this as P(event). An event is anything, no matter how big or small, that could happen. So if I was considering the probability of it raining, I would write P(rain). Or if I was considering the probability of getting heads when flipping a coin, I would write P(heads). Now when actually calculating probability we need to consider the 2 different types. So if I have a coin in my hand and I'm going to flip it but I want to know the probability of getting heads if I do. Since this is based on what could possibly happen, this is referred to as theoretical probability. But if I were instead to take that coin and flip it 3 times and record the results of each flip and calculate the probability of getting heads based on that, since this is based on what actually did happen, this is referred to as empirical or experimental probability since we performed an experiment here. Now when calculating the theoretical probability of getting heads, since I know there are only 2 possibilities when I flip a coin, heads or tails, and only one of those is heads, the theoretical probability of getting heads on a coin flip is equal to 12. Now with our empirical probability over here, since we got heads on 2 out of those 3 tosses, the empirical probability of getting heads on a coin flip is equal to 23. Now, the most important thing to consider here is that our theoretical probability was calculated before any events actually happened, whereas our empirical probability was calculated after our events actually occurred based on data. Now when looking at our formulas that we actually used to calculate these here, these look slightly different just because they're tailored to each different type of probability, but they're really the same thing. So with our theoretical probability here, we took the number of outcomes that included our event. So in this case there was only one way to get heads, and then we divided that by the number of total possible of times our event actually occurred, in this case twice, and divided that by the number of total trials. So we still took our event and divided it by our total. Now that we've seen the basics of calculating probability, let's work through some examples together. So looking at our first example here, we're asked, when rolling a 6-sided die, what is the probability of rolling a number greater than 3? So here, we're looking for the probability of getting a number greater than 3. Now when rolling a 6-sided die, I know that I could roll any number 1 through 6. And when looking at these possible outcomes here, I see that only 3 of these numbers are greater than 3. So when calculating the probability here, I would take the possible outcomes here that include my event, in this case, 3 of them, and divide it by the number of total possible outcomes. In this case, since there are 6 sides of that die, there is 6 total possible outcomes. Now simplifying this fraction gives me a probability of 12, and you'll often see probabilities reported as decimals. So here, the probability of rolling a number greater than 3 is equal to 0.5. Let's look at our other example here. Here, we're given data and asked to find the probability of rolling a number greater than 3 based on that data of rolling a 6-sided die 10 times. So here we're calculating empirical probability because we're actually given data to work with of events that already happened. So here we're calculating still the probability of rolling a number greater than 3, but we're going to take a look at this data table. So since there were 10 total rolls here, I already know that the number on the bottom of that fraction is going to be 10 for the total number of trials. Then I want to look for the number of times that my event actually occurred. Since my event was rolling a number greater than 3, I want to look for the number of times that that happened. So on that first roll, I got a 6, then I got a 4, then I got a bunch of fives in a row and a 6 and then a 4 and a 5. So 8 out of those 10 times, I roll the number greater than 3. So taking that probability and simplifying that fraction, I get a probability of 45 or as a decimal 0.8. Now something that you might be wondering here is why our empirical probability is so different than our theoretical probability when we're technically calculating the probability of the same event. And the answer comes down to our sample size. So since we only did 10 trials, this is not quite so close to our theoretical probability. But if I were to roll the dice a 100 or a 1000 times, I would get closer and closer to that theoretical probability of 0.5. So this is something to consider in your science courses when you're working with your own data. Now, when you're working through probability problems, you may see all of the possible events possible outcomes of an event expressed as a set, so in curly brackets from set notation. Now this will be referred to as a sample space, and it just shows all of the possible outcomes in between those curly brackets. So, for example, the sample space of flipping a coin, I would say that S={heads,tails}. So this here represents the sample space of flipping a coin. Now that we've seen the basics of calculating probability and we're more familiar with some of that notation, let's get some more practice. Thanks for watching, and I'll see you in the next one.
- 0. Fundamental Concepts of Algebra3h 29m
- 1. Equations and Inequalities3h 27m
- 2. Graphs43m
- 3. Functions & Graphs2h 17m
- 4. Polynomial Functions1h 54m
- 5. Rational Functions1h 23m
- 6. Exponential and Logarithmic Functions2h 28m
- 7. Measuring Angles39m
- 8. Trigonometric Functions on Right Triangles2h 5m
- 9. Unit Circle1h 19m
- 10. Graphing Trigonometric Functions1h 19m
- 11. Inverse Trigonometric Functions and Basic Trig Equations1h 41m
- 12. Trigonometric Identities 34m
- 13. Non-Right Triangles1h 38m
- 14. Vectors2h 25m
- 15. Polar Equations2h 5m
- 16. Parametric Equations1h 6m
- 17. Graphing Complex Numbers1h 7m
- 18. Systems of Equations and Matrices1h 6m
- 19. Conic Sections2h 36m
- 20. Sequences, Series & Induction1h 15m
- 21. Combinatorics and Probability1h 45m
- 22. Limits & Continuity1h 49m
- 23. Intro to Derivatives & Area Under the Curve2h 9m
Probability - Online Tutor, Practice Problems & Exam Prep
Probability is a fundamental concept used to assess the likelihood of events, calculated through theoretical and empirical methods. Theoretical probability is determined before events occur, while empirical probability is based on actual outcomes. Events can be mutually exclusive, where they cannot happen simultaneously, or non-mutually exclusive, where overlap exists. For independent events, the probability of both occurring is found by multiplying their individual probabilities. Understanding these concepts is crucial for analyzing real-world scenarios, such as weather forecasts or game outcomes.
Introduction to Probability
Video transcript
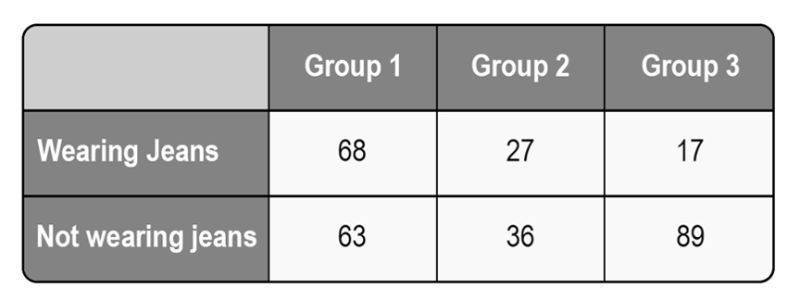
Given the data below, determine the probability that a person randomly selected from Group 1 will be wearing jeans.
0.37
0.48
0.52
0.63
In your coin purse, you have 3 quarters, 4 nickels, & 2 dimes. If you pick a coin at random, what is the probability that it will be a quarter?
0.33
0.44
0.50
0.66
Introduction to Probability Example
Video transcript
Hey everyone. In this problem, we're told that whenever playing a particular lottery game, you must choose five numbers between 1 and 40, and you win if those five numbers match those drawn in the lottery. So we want to find the probability that you will win if you purchase 1 lottery ticket and if you purchase 50 different ones. So let's go ahead and get started here. Now, in calculating probability, we have to take the number of outcomes that include our event and divide that by the number of total possible outcomes. But here, there are a lot of possible outcomes because there are a lot of different ways that you could choose five numbers between 1 and 40. Now I don't want to have to write all of those out and figure them out manually, so we actually can use a tool that we've used in the past year, and that's our combinations formula. We can use this to calculate all of the possible combinations of 5 numbers between 1 and 40. So before we can calculate our probability, we first need to come up with a number of total possible outcomes using that combinations formula. So here we see that our value for n is going to be equal to 40 because we're choosing out of 40 different numbers. But out of those 40 numbers, we're only choosing 5, so that represents our value for r. So here, I'm going to calculate C405 or the combinations of 5 objects out of 40 total possible objects. So here, plugging these values into my formula, we're gonna go ahead and take mn40 factorial and divide it by mn40 minus mi5 factorial times mi5 factorial. Now from here, we can simplify this to mn40 factorial divided by mn35 factorial times mi5 factorial. Now from here, if you know how to use the factorial button on your calculator, you can go ahead and just type this in and go from there. But here, I'm going to walk you through how to do it by hand just in case you want to see that. So from here, we're going to rewrite that numerator in order to cancel out the highest factorial in our denominator, which in this case is mn35 factorial. So doing that, we can rewrite that numerator as mn40 times mn39 times mn38 times mn37 times mn36 finally times mn35 factorial. Now all of this, of course, is divided by mn35 factorial times mi5 factorial. And that mn35 factorial on the top and the bottom cancels just as we wanted it to. Now in my numerator I'm left with mn40 times mn39 times mn38 times mn37 times mn36 And in my denominator, I'm left with mi5 factorial. Now that mi5 factorial can get expanded out into 5 times 4 times 3 times 2 times 1. So in my numerator, I have some multiplication happening as well in my denominator. Now doing that multiplication and then dividing that numerator by my denominator, I get a final answer of 658,008 total possible combinations here. So this tells me the number of total possible outcomes when calculating my probability. Now we can go ahead and calculate our probability. So the probability of winning with 1 single lottery ticket, if I purchase 1 lottery ticket, there's only one possible way that I could win if my one lottery ticket matches what's drawn. So I'm going to take that one and divide it by my total, 658,008. Now, this as a fraction might not mean much to you. But if we put this as a decimal, this gives me a value of 0.000152 and this is our probability of winning with 1 single lottery ticket. So our chances don't look too great here, but let's look if we were to buy 50 different lottery tickets. So here, now the probability of winning there are now 50 different ways I could win if any one of my 50 purchased lottery tickets matches what was drawn. So if I take that 50 and still divide it by that same total, 658,008, I get a decimal value of 0.00076. So a little bit higher possibility of winning the lottery here, but maybe not quite as high as we'd want to see. So now that we know how to find probabilities with also using our combinations formula, thanks for watching, and I'll see you in the next one.
Complementary Events
Video transcript
Hey, everyone. We just learned how to find the probability that some event will happen, like, say, rolling a 6 sided die and getting a 4. But what about the probability that some event will not happen? Well, this is something that you'll actually be asked explicitly to calculate and it may sound like it's going to be tricky, but you can actually do it using something that we already know. So here I'm going to walk you through how to calculate the probability that some event will not happen by simply using the probability that it will. So let's go ahead and get started here. Now all of the possible outcomes where some event does not happen actually has its own special name, and it's referred to as the complement of that event. So when looking at my dice roll here, if I consider all of the possible outcomes of not rolling a 4, like rolling a 1, 2, 3, 5, or 6, all of these outcomes together represent the complement of rolling a 4. Now if we refer to our event as a, we can use a special notation to denote the complement of a. So you may see this written as a with a little apostrophe after it or with a line over it or with a little symbol in front of it that just means not. All of these are different ways to denote the complement of a. Now that we know what the complement is, let's dive deeper into our dice roll example here. So in this example, we're asked, when rolling a 6 sided die, what is the probability that we will roll a 4? Now if we refer to this event as a, the probability of a is equal to the number of outcomes that include that event. So in this case, there's only one way I could roll a 4 divided by the number of total possible outcomes. So since this is a 6 sided die, all of my total outcomes are 6. So the probability of a is 16. But what about the probability that we will not roll a 4 or the probability of the complement of a? Well, I know that I have 5 possible outcomes that I would not roll a 4 because I could roll a 1, 2, 3, 5, or 6. So here I take all of the total outcomes that include that event, not rolling a 4, and divide it by the number of total possible outcomes, in this case, still 6. Now looking at these, if I were to take the probability of a and the probability of the complement and add them together, I see that I get 66, which is just 1. Now, this makes sense, right, because we've covered 100% of the possibilities of rolling a 6 sided die, rolling a 1, 2, 3, 5, 6, or a 4. So it makes sense that the total probability of all possible events is simply 1. Now, this is always going to be true. The probability of some event plus the probability of its complement is going to be equal to 1. And we can use this formula over here to more easily calculate the probability of something not happening by rearranging a little bit here. So if I were to subtract the probability of a from both sides here, it will cancel on that left side, leaving me to see that the probability of the complement of a is equal to 1-a. So here I see that the probability that something does not happen is simply 1-a. So now that we know this formula, let's apply it to another example here. In this example, I'm asked when drawing a single card from a standard deck of 52, what is the probability that I will not draw a queen? Well, instead of trying to find all of the cards that are not a queen, let's just consider all of the cards that are queens. So if I look at the probability of getting a queen, I know that in a standard deck of 52 cards, there are 4 queens. So I take all of the outcomes that include my event, drawing a queen, and put that over the number of total possible outcomes. In this case, since I have 52 total cards, my total is 52. Then to find the probability of not drawing a queen, I can simply take 1 minus the probability of drawing that queen, which we just calculated. So we can go ahead and plug in 452 here. Now I know that one is simply the same thing as 5252, just getting a common denominator here, so if I perform this subtraction I end up with 4852, which as a decimal is 0.92. So the probability of not drawing a queen is 0.92, and we found that by simply using the probability of drawing a queen without having to count up those 48 cards. So now that we know how to find the probability of something not happening, let's get some more practice. Thanks for watching, and I'll see you in the next one.
When drawing a marble out of a bag of red, green, and yellow marbles 8 times, a red or yellow marble is drawn 6 times. What is the probability of drawing a green marble?
0.025
0.125
0.25
0.75
A weatherman states that the probability that it will rain tomorrow is 10%, or 0.1, & the probability that it will snow is 25%, or 0.25. What is the probability that it will not rain or snow?
0.35
0.65
0.75
0.90
Probability of Mutually Exclusive Events
Video transcript
Hey, everyone. So far, we've been dealing with the probability of individual events, like, say, the probability of picking a blue shirt out of my closet to wear on a given day. But what about the probability of multiple events? And further than that, what about multiple events that can happen at the same time, like say wearing a blue shirt with a green pair of pants, versus those that cannot, like say wearing a blue shirt and wearing a green one too. Well, this might sound like it's going to be complicated but here I'm going to break it down for you and show you exactly what the difference is between events that can happen at the same time versus those that can't, so that we can calculate the probability of those that can't. So let's go ahead and get started here.
Now events that cannot happen at the same time actually have their own special name and they're referred to as being mutually exclusive. You might see multiple events represented using a circle diagram like this one that we see here. Here, we have event A wearing a blue shirt and event B wearing a green shirt. In this circle diagram, you might notice that these are two completely separate circles. I have event A and event B, but there's no region of overlap. Because these events are completely separate, they cannot happen at the same time. It's either wear a blue shirt or wear a green shirt, but never both. Now because of that, these events can't happen at the same time. They're referred to as being mutually exclusive. They're completely exclusive from one another.
Now over here, we have event A as still wearing a blue shirt, but we have event B as wearing green pants. In this circle diagram, we see this region of overlap in the middle, and this represents both of these events happening together, wearing a blue shirt with a green pair of pants. So because of this overlap, we see that these events can happen at the same time, and that means that they are not mutually exclusive. Now we're going to have to differentiate between sets of events that are mutually exclusive versus those that are not. So let's get a bit more practice with that now that we know what mutual exclusivity even is.
Looking at this set of examples here, I see getting heads when flipping a coin versus getting tails. Now, whenever you flip a coin, we know that there are only two things that could happen. I could either get heads or I could get tails, but I can never get both at the same time on a single coin flip. Now, because these can't happen at the same time, these are mutually exclusive. They're completely exclusive from one another, and their circle diagram would look similar to this one up here.
Now let's look at our second set of events here. We have getting a 6 when rolling a die versus getting a number higher than 3. Now let's think about this a little bit. When we roll a 6, there's only one way to do that, by rolling a 6. But if we want to roll a number higher than 3, we could get a 4, a 5, or a 6. There are three possible outcomes here. Now, one of those outcomes is getting a 6, which is exactly what my other event is. So if I were to roll a 6, I would be satisfying both of those events, and they would be happening at the same time. Now because of that, these events are not mutually exclusive.
Now here we want to dive deeper into our events that are mutually exclusive and calculate the probability of some event A or some event B occurring. So to find the probability of any one of multiple mutually exclusive events occurring, all we're going to do is add the probabilities of each of them. So I'm going to take the probability of event A and add it together with the probability of some event B. And that's all. This will give me the probability of my two events, A or B, occurring. Now, this is sometimes referred to as "or" probability because it's A or B, but never both since they can't happen at the same time. And you might see this with this little U symbol that just means "or" in set notation.
So now that we've seen this formula, let's go ahead and apply it to an example. Here, we roll a 6-sided die, and we want to know the probability of getting a 3 or getting a 5. So I have two events here. I have rolling a 3 or rolling a 5. So here, I want to calculate the probability of rolling a 3 or rolling a 5. So with this color coded here, we see our two events, 3 or 5. And in order to calculate this probability, we saw that we just need to go ahead and add these together. So I'm going to take the probability of rolling a 3, and then I'm simply going to add it together with the probability of rolling a 5. So we just need to look at these individual probabilities to come to our final answer here. So I know that whenever I roll a 6-sided die, there's only one way that I could roll a 3 by just rolling that. Right? So there's one way to get to that outcome, and there are 6 total possible outcomes here because it's a 6-sided die. Now I'm going to take that probability and add it together with my probability of rolling a 5. Now I know that there's also only one way to roll a 5 here, so this probability will actually end up being the same. So I have 1/6+1/6. Now actually adding these two together gives me a value of 2 over 6 or as a simplified fraction, 1 third. Now we know that 1 third as a decimal is equal to around 0.33, and that would go on and on. So our probability here of rolling a 3 or rolling a 5 is equal to 1 third or 0.33.
Now that we know what "OR" probability is and how to calculate it for mutually exclusive events, let's get some more practice. Thanks for watching, and I'll see you in the next one.
If a single card is randomly selected from a deck of cards, what is the probability of selecting an ace or a king?
0.0059
0.077
0.15
0.85
For two mutually exclusive events A and B, compute P(A∪B) if P(A)=0.15 and P(B)=0.32
0.048
0.17
0.47
0.53
Probability of Non-Mutually Exclusive Events
Video transcript
Hey everyone. We just learned how to calculate the or probability of 2 mutually exclusive events by simply adding the individual probabilities together. But what about the or probability for 2 non mutually exclusive events? Well, you may be worried that we're going to have to learn a brand new formula here, but you don't have to worry about that because here I'm going to walk you through how calculating the or probability for non mutually exclusive events is actually almost identical to calculating it from mutually exclusive events, just with one extra step added in. So let's go ahead and get started so that then you can calculate the or probability for any events. So looking at this, remember for our non mutually exclusive events, there exists this region of overlap in the middle where both of these events are happening at the same time. Event A and event B are happening here. Now in set notation, you'll see this written as A and B with this little upside down U symbol that just means AND. Now, in actually calculating the probability of A or B happening for these non mutually exclusive events, we're going to start out the same exact way we did for our mutually exclusive events. We're going to take the probability of our event A, in this case wearing a blue shirt, whether it be with green pants or not, and we're going to add in our probability of event B, in this case, wearing green pants. But in adding in our probability of wearing green pants, we already accounted for the time that it got worn with our blue shirt. So wouldn't we be counting it twice here? Well, we would be counting it twice. So we really just want to add in the time where we're wearing green pants without a blue shirt. But how do we do this? Well, in order to get rid of that extra outcome and not count it twice, we need to subtract the probability of that overlap region, the probability of A and the probability of B, in order to only have counted that area once. So in order to calculate the probability of A or B occurring, we're still adding probability of A plus the probability of B, but now we're just subtracting the probability of A and B. Now this might seem a little bit abstract and overwhelming seeing this equation for the first time. But here, we're going to walk through an example together. So let's go ahead and take a look at this example down here. And we'll see exactly how this equation works. So here we see when rolling a 6 sided die, what is the probability of rolling a number greater than 3 or an even number? So here we have 2 events, events, rolling a number greater than 3 or rolling an even number. So when rolling a 6 sided die, let's think through all of our possible outcomes here. Well, we could roll a 1, but that actually isn't a part of either of our events. We could also roll a 2. Now, a 2 is even, but it's not greater than 3. We could also roll a 3 which is not a part of any of my events either. Then I could roll a 4. Now a 4 is both even and greater than 3 so it's going to go in this middle region here. Then I could roll a 5. A 5 is not an even number but it is greater than 3. Then finally, I could roll a 6 which again is both greater than 3 and even, so it's going to go in this overlap region here. Now from here, let's go ahead and get into calculating this probability, the probability that we'll roll a number greater than 3 or an even number. Now, in doing this, remember, we're going to take those individual probabilities and add them together to start out here. So we're going to take the probability of rolling a number greater than 3. Looking at my circle diagram here, I see that there are 3 possible outcomes, either a 4, a 5, or a 6, out of 6 total possible outcomes. So that's my first probability. Then for my second event, rolling an even number, I could roll a 2, a 4, or a 6 out of 6 total_possible outcomes again. So again, we get 3 over 6 here. But now I need to subtract that region of overlap where my numbers are both greater than 3 and even. And looking at my diagram here, there are 2 outcomes in which that would happen, rolling a 4 or rolling a 6. So here I'm going to take that 2 over my 6 total possible outcomes. Now from here, all that's left to do is addition and subtraction. So first, taking that addition, 3/6 plus 3/6 is going to give me a 6 over 6. And then I'm subtracting that 2 over 6. Now subtracting that gives me 4 over 6 or, as a simplified fraction, 2/3. Now, as a decimal, if you want to express your probability here as a decimal, this gives us 0.67. So the probability of rolling a number greater than 3 or an even number is equal to 0.67. Now, this makes sense, right, because looking at this number, 4 over 6, and comparing that to our circle diagram, there are 4 possibilities that are part of both of these events. So a 5, a 4, a 6, or a 2, those are 4 things that are either greater than 3 or an even number, maybe both mixed in there. And it's 6 total outcomes. So 4 over 6 makes perfect sense here. Now having calculated the or probability for mutually exclusive and non mutually exclusive events, it may seem like there are 2 separate formulas to remember here, but not really, because this orange formula here is actually the most general way to calculate the probability of any 2 events, A or B, whether they're mutually exclusive or not. But if they are mutually exclusive, this last term is just going to be 0. So this formula will end up looking like this for our mutually exclusive events. So the equation for the probability of A or B is really the same regardless of mutual exclusivity. But for our mutually exclusive events, the probability of A and B is simply always going to be 0. So now that we know how to find the or probability for any 2 events, mutually exclusive or not, let's get some more practice. Thanks for watching, and let me know if you have questions.
Probability of Non-Mutually Exclusive Events Example
Video transcript
Hey, everyone. In this problem, we're given a data table, and we're told that this table shows the outfits of 300 observed people on a given day. And we want to know if one person is randomly selected from this group of 300 people, what is the probability that they will either be wearing shorts or wearing a green shirt? Now, this might look overwhelming just because there's a lot of data, but let's go ahead and interpret it together. So we see that of the people that are wearing shorts, we come to a total of 188 out of those 300 people that are wearing shorts. Now for our second event, wearing a green shirt: there are 106 total people wearing a green shirt, and we can see that breakdown. This is a great way to visualize non-mutually exclusive events because we see this region of overlap here where both of these things are happening. People are wearing a green shirt with shorts, so both of these events happen together.
Whenever we're dealing with events that are non-mutually exclusive, we know that we need to account for that region of overlap when calculating the probability. So we know that the probability of our events A or B happening is equal to adding those 2 events together, so taking the probability of A; in this case, we'll refer to wearing shorts as event A, and then adding that with the probability of event B; in this case, wearing a green shirt, and then subtracting that region of overlap. So, subtracting the probability of A and B happening, just as we see in our table here. People are doing both event A and event B.
Now we can go ahead and use our data to fill in the gaps here and calculate our final probability. So for the probability of event A, we know that there are 188 out of 300 total people wearing shorts. We want to take that 188, put it over a total of 300. Then we want to add that together with our probability of event B. So we see that there are 106 total people wearing a green shirt. So we can take that 106, and again, put it over our total of 300. Then finally, we want to subtract that region of overlap, the people that are doing both of these events: wearing shorts with a green shirt. So we're going to take that number of 89 and put it over our total as well, so 89 over 300. Now from here, we're just left to do this calculation. So I can go ahead and add these two values together, and that gives me a number of 294 over 300. That's a lot of people doing both of those events, but I need to subtract that region of overlap. So subtracting that 89 over 300 doing this subtraction, I end up with a value of 205 over 300. It's still a significant amount of people, but not quite so many. Now we can go ahead and reduce this fraction to 41 over 60. Or if you want to express this as a decimal, this goes down to 0.68 as our final answer. So, for one randomly selected person from this group of 300, the probability that they will be wearing shorts or a green shirt, maybe even both, is 0.68. Thanks for watching, and I'll see you in the next one.
A card is drawn from a standard deck of 52 cards. What is the probability that the card is a diamond or a king?
0.33
0.31
0.15
0.85
Probability of Multiple Independent Events
Video transcript
Hey, everyone. So far, we've learned how to calculate the probability of one event or another event happening, like, say, getting heads or tails on a single coin flip. But what if someone asked you to calculate the probability of getting heads on one coin flip and then getting tails on another coin flip? Well, it turns out that this is actually an entirely different type of probability that you might hear referred to as and probability. Now we're going to have to calculate this and probability, but before we dive too deep into that, we're going to need to talk about what it means for events to be independent from each other. I know that might sound like a lot, but here I'm going to walk you through exactly what it means for two events to be independent or dependent and then how to calculate the and probability of two events that are independent. So let's go ahead and get started.
When considering two different events, if these two events do not depend on each other, they are referred to as being independent. In other words, the outcome of one event has no effect whatsoever on the outcome of the other event. This can seem a little bit abstract, so let's take a look at some different sets of events and determine whether or not they're independent. Looking at my first example here, I have getting tails on the first toss of a coin and then getting tails on the second toss of a coin. What happens in the first toss has no effect whatsoever on what happens in the second toss, so that tells me that these events are independent from each other. What happens in one doesn't affect what happens in the other.
Let's look at another set of events here. We have drawing and keeping a blue marble from a bag and then drawing a blue marble again. If I consider what's actually happening here, if I reach into that bag and I draw a blue marble on that first draw and I keep it in my hand and then I go back in the bag and I want to know the probability of drawing a blue marble again, well, I've already removed one of the blue marbles, so my chances have lessened because of what happened in that first event. Because what happens in the first event affects what happens in the second, these two events are not independent. They are dependent because what happens in one depends on what happens in the other.
Now that we've seen how to determine whether events are independent or dependent, let's take a closer look at our independent events here. For two independent events, we're going to need to calculate the probability of event a and event b occurring. Earlier, I said that you might hear this referred to as and probability, and in set notation, you'll see this denoted with this little upside down u symbol that just means and. Actually calculating this probability is super simple because all we're going to do is multiply our probabilities together. We're going to take the probability of event a occurring and simply multiply it by the probability of event b occurring in order to get the probability of a and b occurring. Now that we've seen this formula, let's go ahead and apply it to some examples that we'll work through together.
Looking at our first example here, we want to find the probability of getting heads on two consecutive coin flips, so the probability of getting heads and then getting heads again on a second flip. So in order to do this, we're just going to take these individual probabilities and multiply them together. We're going to take the probability of getting heads on that first flip and then multiply it by the probability of getting heads on the second flip. So looking at these probabilities, I know that there are only two possibilities when flipping a coin, either heads or tails, and only one of those is getting heads. So here, the probability of getting heads on that first coin flip is \( \frac{1}{2} \). Now I'm going to multiply this by the probability of getting heads on the second coin flip, which is actually going to be the exact same thing because again there are still two possible outcomes getting heads or tails and only one of those is getting heads. So I'm going to take that one half and multiply it \( \frac{1}{2} \times \frac{1}{2} \). Now when we multiply across here I'm going to end up getting \( \frac{1}{4} \) or as a decimal 0.25 as my probability of getting heads and then getting heads again. Now we can actually reason this out because there's not a ton of possibilities here. Right? So if I consider the first flip of a coin and the second flip of a coin, on that first flip, I could get heads. Then on my second flip, I could get heads again, or I could get heads on that first coin flip and then get tails on the second. But I could also get tails on the first flip and then get heads on the second, or I could get tails on the first flip and tails on the second. Now these are the only four possible things that could happen and only one out of these fours is getting heads on two consecutive coin flips. Now this backs up what we just calculated because we found that there is a 1 in 4 chance of getting heads on two consecutive coin flips.
Now let's take a look at another example here. We have rolling an even number on the first roll of a 6 sided die and then rolling a 3 on the second roll. So we're trying to find the probability of getting an even number and then getting a 3 when rolling this die. So of course we're going to take these individual probabilities and multiply them together. We're gonna take the probability of getting an even number and then multiply it by the probability of getting a 3. When rolling a 6 sided die, I know that there are 6 total possibilities. And in order to roll an even number, I could either get a 2, a 4, or a 6, and those would all be even numbers. So that tells me since there are 3 possible ways to get an even number, that my probability of getting an even number at all is 3 out of those 6 total possibilities. Now I'm gonna multiply this by the probability of rolling a 3, which there is only one way to roll a 3, so I know that this probability is \( \frac{1}{6} \). Now, again, multiplying across here, this is going to give me \( \frac{3}{36} \), which as a decimal is simply 0.08, so not a very high chance that I'll roll an even number and then roll a 3.
There's one final thing that I want to mention for if you ever run into a problem that asks you to find the and probability of more than two independent events. It's super simple. All you're going to do is keep multiplying all of those probabilities together to find the probability of a and b and c occurring. Just keep multiplying those individual probabilities. Now that we know how to find the and probability of multiple independent events, let's get some more practice. Thanks for watching, and I'll see you in the next one.
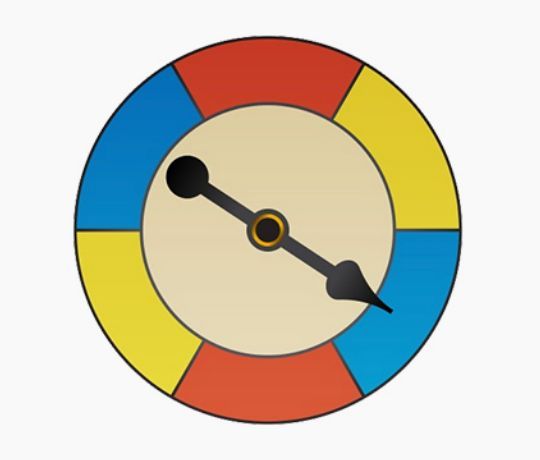
The spinner below has 6 equal regions. Find the probability of landing on yellow for the first spin and not landing on yellow on the second spin.
0.11
0.22
0.66
0.88
The spinner below has 6 equal colored regions numbered 1-6. Find the probability of stopping on yellow for the first spin, stopping on an even number on the second spin, and stopping on blue or red on the third spin.
0.11
0.17
0.50
0.89
Here’s what students ask on this topic:
What is the difference between theoretical and empirical probability?
Theoretical probability is calculated based on the possible outcomes of an event before it actually happens. It is determined by dividing the number of favorable outcomes by the total number of possible outcomes. For example, the theoretical probability of getting heads in a coin flip is 1/2. Empirical probability, on the other hand, is based on actual data from experiments or observations. It is calculated by dividing the number of times an event occurs by the total number of trials. For instance, if you flip a coin 10 times and get heads 7 times, the empirical probability of getting heads is 7/10. The key difference is that theoretical probability is based on expected outcomes, while empirical probability is based on observed outcomes.
How do you calculate the probability of an event not happening?
The probability of an event not happening, also known as the complement of the event, can be calculated using the formula:
Here, is the probability of the event happening, and is the probability of the event not happening. For example, if the probability of drawing a queen from a deck of 52 cards is 4/52, then the probability of not drawing a queen is:
What are mutually exclusive events in probability?
Mutually exclusive events are events that cannot happen at the same time. If one event occurs, the other cannot. For example, when flipping a coin, getting heads and getting tails are mutually exclusive events because you cannot get both heads and tails on a single flip. In a Venn diagram, mutually exclusive events are represented by non-overlapping circles. The probability of either event A or event B occurring (but not both) is calculated by adding their individual probabilities:
For example, if the probability of rolling a 3 on a die is 1/6 and the probability of rolling a 5 is also 1/6, then the probability of rolling a 3 or a 5 is:
How do you calculate the probability of independent events?
To calculate the probability of two independent events both occurring, you multiply their individual probabilities. Independent events are those where the outcome of one event does not affect the outcome of the other. The formula is:
For example, if the probability of getting heads on a coin flip is 1/2 and the probability of rolling a 3 on a six-sided die is 1/6, then the probability of both getting heads and rolling a 3 is:
This means there is an 8.3% chance of both events occurring.
What is the sample space in probability?
The sample space in probability is the set of all possible outcomes of an experiment. It is often denoted by the letter S and is represented using set notation with curly brackets. For example, the sample space for flipping a coin is:
Similarly, the sample space for rolling a six-sided die is:
Understanding the sample space is crucial for calculating probabilities, as it helps identify all possible outcomes and ensures that the probabilities of all outcomes sum to 1.