So at this point in the course, there are a few things that we should be familiar with already. One of the things is how to plot points on a standard x and y graph. Another thing we should be familiar with is what a complex number is. And recall that complex numbers have this form: x + yi. Now, what we're going to be doing in this video is seeing how we can take both of these concepts and combine them into one. We're going to be learning how we can take complex numbers and plot them on these kind of x-y type of graphs. And it turns out this process is actually very straightforward and very similar, nearly identical to how we plotted points just on the standard graph. So without further ado, let's take a look at this.
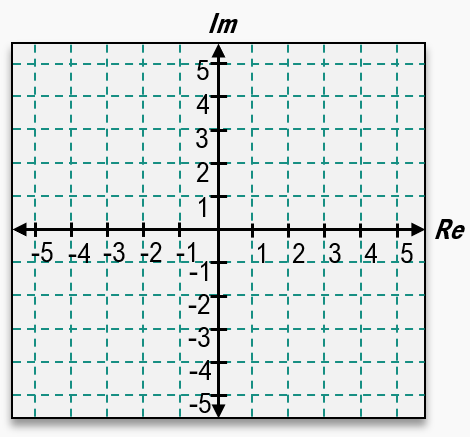
Now, when dealing with complex numbers, there's one main difference when it comes to graphing them. Rather than having a typical graph, you're going to have what's called a complex graph, or a complex plane. And a complex plane has both a real axis and an imaginary axis. Now thankfully, both of these axes act just like the x and y axis did. They just tell us how we can plot certain points on the graph. So if we have a complex plane, what we have is the real axis, which is the horizontal. It takes the place of the x-axis. And we have something called the imaginary axis which takes the place of the y-axis. Now if I have a complex number like this one here, 3 + 2i, if I want to write a point or I want to plot this on our graph, we can use the same logic that we used for plotting a point. The first number is going to tell us how far we need to travel on the real axis, and the second number tells us how far we need to travel on the imaginary axis. So let's go ahead and do this. I'm going to start with the real part, the x part right here, and I can see that that's 3. So that means I need to go 1, 2, 3 units to the right on the x-axis. Now I can see that the imaginary part is 2. So that means I need to go up 1, 2 units on the imaginary axis. Now I can see that the lines intersect right about there. So that means our point for 3 + 2i, the complex number, is going to look like that. And that's all there is to it. That's how you can plot these points.
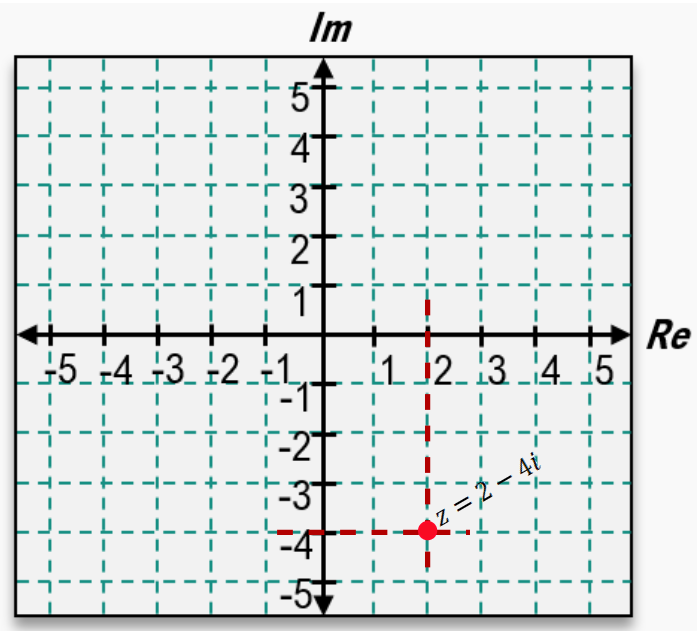
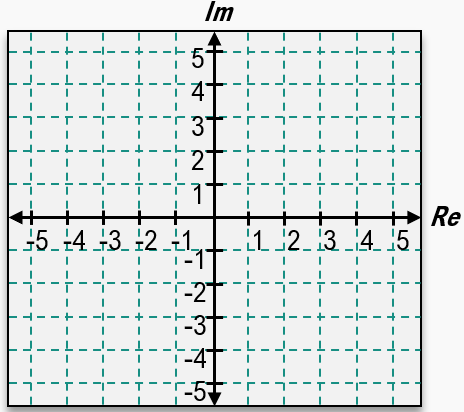
So that is how you can plot complex numbers. As you can see, it's very straightforward. But to make sure that we understand this well and we can solve some more complicated examples, let's go ahead and try a couple more situations. Now, we'll start with example a, which asks us to plot the following complex number. Now, you can see we have this form, 2 - 4i. And recall for complex numbers, they show up in the form x + y i. Now first, the real part is going to be this x here. I can see that that's positive 2. And the imaginary part I can see is this negative 4 since we have minus 4 i. So if I go over here to our graph, that means I need to go 1, 2 units to the right on the real axis, and I need to go 1, 2, 3, 4 units down to negative 4 on the imaginary axis. That's the real part and the imaginary part respectively, so our point is going to be right about there. And this is the point 2 - 4i. That's it. So that's the solution for example a. Now let's go ahead and try example b. For example b, we have 3i as our complex number. But this is kind of confusing because the form should be x + y i. So where exactly is our x? We only have yi, it seems like. Well, that does happen. And think about this, 3i, this is the same thing as 0 + 3i. We could write it like that because 0 plus anything is just whatever that number is. And since it's 0 + 3i, that means the real part is actually 0. The imaginary part we can see is positive 3. So if we go over here to our graph, we don't need to go to the left or to the right on the real axis. We just stay right here in the middle. But for the imaginary part, since it's positive 3, we need to go up 1, 2, 3 units. So our point is going to be right here, and that's the complex number 3i. So those are the two points on our graph and the solution to examples a and b.
So that is how you can solve these types of problems. As you can see, it's just like plotting points on an x-y graph, except this time you have a real part and an imaginary part, and you use that to figure out where your points are. I hope you found this video helpful. Thanks for watching, and let's get some more practice.


