Join thousands of students who trust us to help them ace their exams!
Multiple Choice
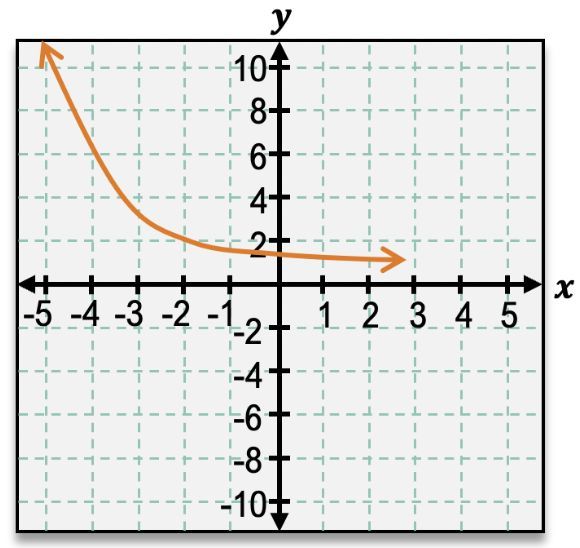
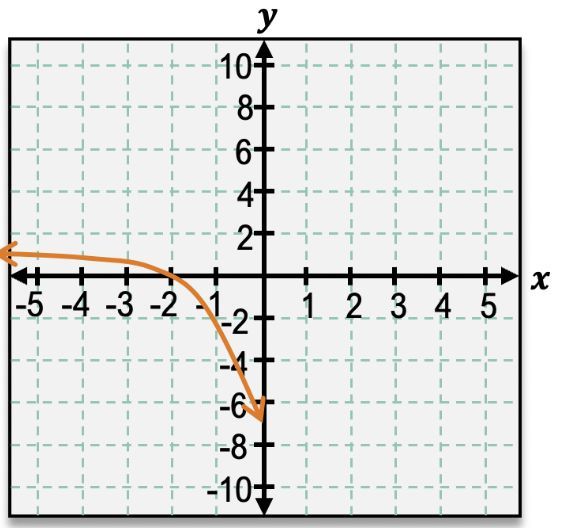
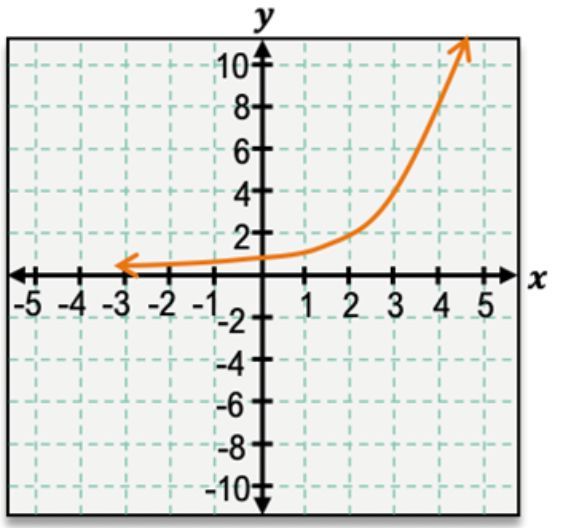
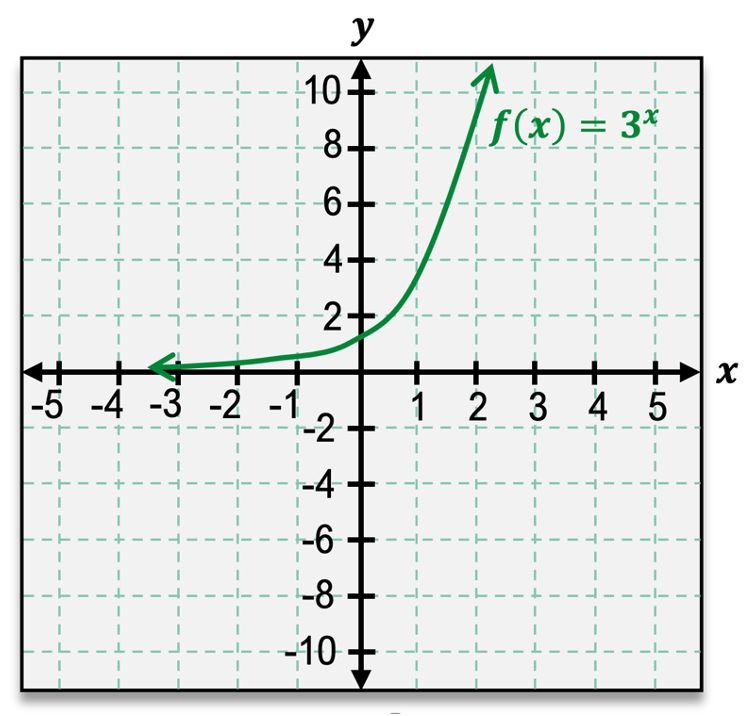
The graph for the function f(x)=3x is given below. Match the given function, g(x), to its graph. g(x)=−3x+2+1
A
B
C
0 Comments
Verified step by step guidance
1
Identify the function type: The function g(x) = -3^(x+2) + 1 is an exponential function with a negative base, which means it will have a reflection across the x-axis compared to a positive base exponential function.
Consider the transformation: The term (x+2) indicates a horizontal shift to the left by 2 units. The +1 outside the exponential function indicates a vertical shift upwards by 1 unit.
Analyze the graph behavior: Since the base is negative, the graph will decrease as x increases, and the horizontal and vertical shifts will adjust the position of the graph accordingly.
Compare with the given graphs: Look for a graph that shows a decreasing trend, has been shifted left by 2 units, and shifted up by 1 unit.
Match the graph: The correct graph will show the characteristics of a reflected exponential decay, shifted left and up, which should match one of the provided graphs.


 Verified step by step guidance
