Join thousands of students who trust us to help them ace their exams!
Multiple Choice
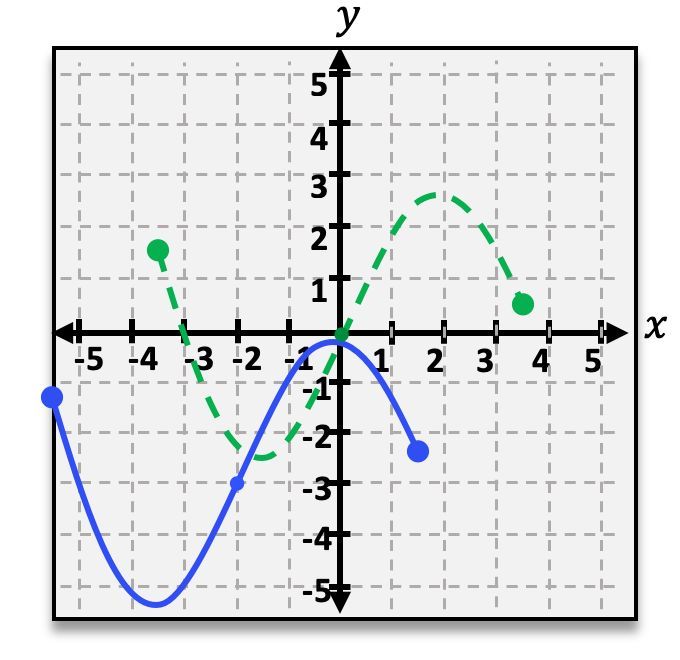
The green dotted line in the graph below represents the function f(x). The blue solid line represents the function g(x), which is the function f(x)after it has gone through a shift transformation. Find the equation for g(x).
A
g(x)=f(x−2)+3
B
g(x)=f(x−2)−3
C
g(x)=f(x+2)−3
D
g(x)=f(x)−3
0 Comments
Verified step by step guidance
1
Observe the graph: The green dotted line represents the function f(x), and the blue solid line represents the function g(x), which is a transformation of f(x).
Identify the transformation: The blue line appears to be shifted horizontally to the left and vertically downward compared to the green line.
Determine the horizontal shift: The graph of g(x) is shifted 2 units to the left compared to f(x). This means the transformation involves replacing x with (x + 2) in the function f(x).
Determine the vertical shift: The graph of g(x) is shifted 3 units downward compared to f(x). This means subtracting 3 from the function f(x).
Combine the transformations: The equation for g(x) is g(x) = f(x + 2) - 3, which accounts for both the horizontal and vertical shifts.


 Verified step by step guidance
