6. Exponential and Logarithmic Functions
Graphing Logarithmic Functions

Multiple Choice
Graph the given function.
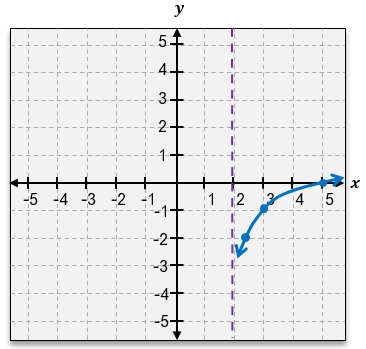
A
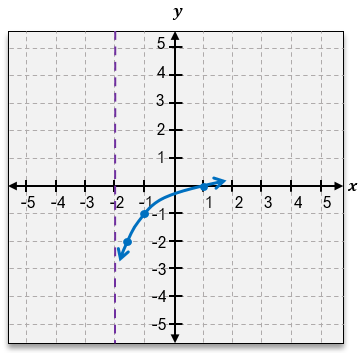
B
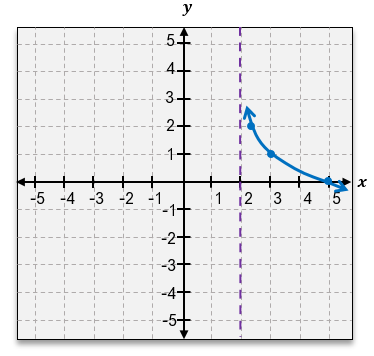
C
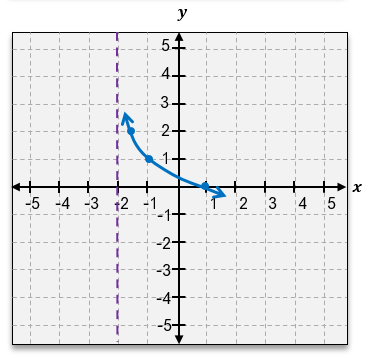
D
 Verified step by step guidance
1
Identify the function to be graphed: g(x) = log_2(x - 1) - 4.
Determine the domain of the function. Since the logarithm is undefined for non-positive numbers, x - 1 > 0, which implies x > 1.
Identify the vertical asymptote. The expression inside the logarithm becomes zero at x = 1, so there is a vertical asymptote at x = 1.
Determine the transformation of the basic log function. The function log_2(x) is shifted 1 unit to the right and 4 units down, due to the (x - 1) and -4, respectively.
Sketch the graph. Start from just to the right of the vertical asymptote at x = 1, and draw the curve moving upwards to the right, approaching the asymptote as x approaches 1 from the right, and moving downwards due to the -4 shift.


