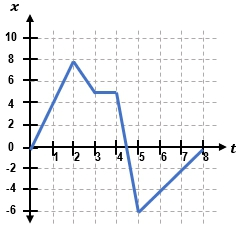
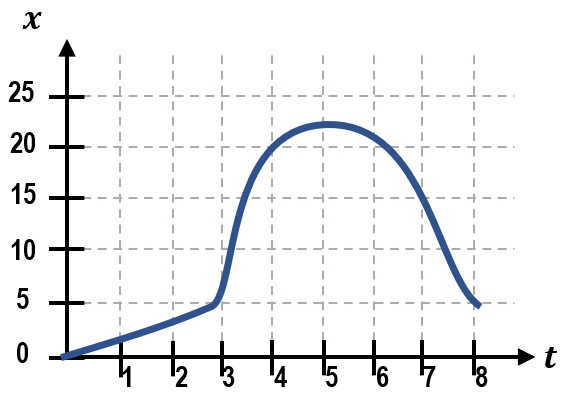
Position-time graphs are essential tools for visualizing the motion of an object, where the vertical axis represents position (denoted as x) and the horizontal axis represents time. Understanding how to interpret these graphs allows us to calculate important quantities like velocity. For instance, if an object moves 6 meters forward in 3 seconds, this motion can be represented on a graph by plotting the points corresponding to its position at each time interval.
To illustrate, if an object starts at the origin (0,0) and moves to (3,6) on the graph, this indicates it has traveled 6 meters in 3 seconds. If the object then remains stationary for 1 second, the graph will show a horizontal line from (3,6) to (4,6), indicating no change in position. Finally, if the object moves back to its starting point, the graph will depict a downward slope from (4,6) to (5,0).
The velocity of an object can be calculated from the slope of the position-time graph using the formula:
\( v = \frac{\Delta x}{\Delta t} \)
Here, \( \Delta x \) represents the change in position (the vertical change or "rise"), and \( \Delta t \) represents the change in time (the horizontal change or "run"). For example, if we analyze the segment from point A to point B, the slope can be visualized as a triangle where the vertical leg represents the change in position and the horizontal leg represents the change in time. A positive slope indicates forward motion, a horizontal slope indicates the object is stationary, and a negative slope indicates backward motion.
To calculate average velocities over specific intervals, one can identify the coordinates of the endpoints of each segment on the graph. For instance, if the object moves from a position of -10 meters to 10 meters over 2 seconds, the average velocity can be calculated as:
\( v_{avg} = \frac{10 - (-10)}{2 - 0} = \frac{20}{2} = 10 \, \text{m/s} \)
In contrast, if the object remains at the same position (10 meters) for the next 2 seconds, the average velocity is:
\( v_{avg} = \frac{10 - 10}{4 - 2} = \frac{0}{2} = 0 \, \text{m/s} \)
For a downward slope, such as moving from 10 meters to 5 meters in 1 second, the average velocity would be:
\( v_{avg} = \frac{5 - 10}{5 - 4} = \frac{-5}{1} = -5 \, \text{m/s} \)
To find the overall average velocity for the entire motion from 0 to 5 seconds, one can connect the initial and final positions on the graph. The average velocity for the entire interval can be calculated as:
\( v_{avg} = \frac{5 - (-10)}{5 - 0} = \frac{15}{5} = 3 \, \text{m/s} \)
It is important to note that the steepness of the slope on the graph correlates with the magnitude of the velocity; steeper slopes indicate higher velocities, while flatter slopes indicate lower velocities. The direction of the slope (upward or downward) indicates the direction of motion. Understanding these concepts is crucial for analyzing motion through position-time graphs.


