Position-Time Graphs & Velocity definitions Flashcards
 Back
BackPosition-Time Graphs & Velocity definitions
1/15
Terms in this set (15)
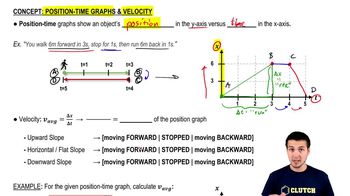
- Position-Time GraphA graph showing an object's position on the y-axis and time on the x-axis, used to visualize motion.
- SlopeThe ratio of the vertical change to the horizontal change on a graph, representing velocity in position-time graphs.
- VelocityThe rate of change of position, represented by the slope of a position-time graph.
- Instantaneous VelocityThe velocity at a specific point in time, determined by the slope of the tangent line on a position-time graph.
- Average VelocityThe total displacement divided by the total time taken, calculated as the slope between two points on a graph.
- Tangent LineA line that touches a curve at a single point, used to determine instantaneous velocity.
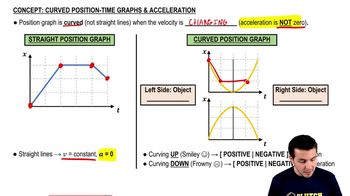
- AccelerationThe rate of change of velocity, indicated by a curved position-time graph.
- Curved GraphIndicates changing velocity and non-zero acceleration on a position-time graph.
- Horizontal SlopeIndicates no change in position, meaning the object is at rest.
- Upward SlopeIndicates forward motion on a position-time graph.
- Downward SlopeIndicates backward motion on a position-time graph.
- PeakThe highest point on a curve where the velocity is zero.
- ValleyThe lowest point on a curve where the velocity is zero.
- SteepnessIndicates the magnitude of velocity; steeper slopes mean higher velocity.
- Smiley Face CurveIndicates positive acceleration on a position-time graph.


