Graphing Position, Velocity, and Acceleration Graphs definitions Flashcards
 Back
BackGraphing Position, Velocity, and Acceleration Graphs definitions
1/15
 07:32
07:32

Terms in this set (15)
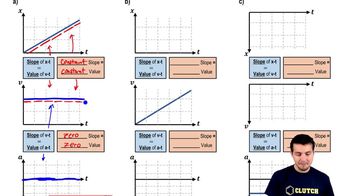
- Position-Time GraphA graph that shows how position changes over time, with the slope representing velocity.
- Velocity-Time GraphA graph depicting how velocity changes over time, where the slope indicates acceleration.
- AccelerationThe rate of change of velocity over time, often represented as the slope of a velocity-time graph.
- Constant SlopeA straight line on a graph indicating a uniform rate of change, such as constant velocity or acceleration.
- Flat LineA horizontal line on a graph indicating no change in the variable, such as zero acceleration.
- Curved LineA line on a graph that indicates a changing rate of change, such as increasing or decreasing velocity.
- Negative AccelerationA decrease in velocity over time, often shown as a downward slope on a velocity-time graph.
- OriginThe starting point on a graph, typically where position and velocity are zero.
- Constant VelocityA steady speed in a straight line, represented by a flat line on a velocity-time graph.
- Decreasing SlopeA slope that becomes less steep over time, indicating a reduction in velocity.
- Increasing SlopeA slope that becomes steeper over time, indicating an increase in velocity.
- Motion VariablesThe three key components of motion: position, velocity, and acceleration.
- SketchA rough drawing representing the main features of a graph without precise measurements.
- Frowny Face CurveA downward curving line on a position graph, indicating negative acceleration.
- Smiley Face CurveAn upward curving line on a position graph, indicating positive acceleration.