Calculating Change in Velocity from Acceleration-Time Graphs definitions Flashcards
 Back
BackCalculating Change in Velocity from Acceleration-Time Graphs definitions
1/15
 05:33
05:33
Terms in this set (15)
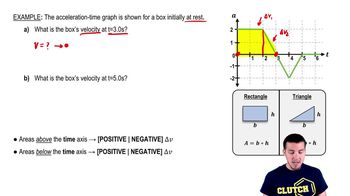
- Acceleration-Time GraphA graph that plots acceleration on the y-axis and time on the x-axis, used to determine changes in velocity.
- Area Under the CurveThe region between the graph line and the time axis, representing the change in velocity in acceleration-time graphs.
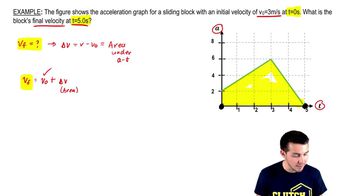
- Change in VelocityThe difference between final and initial velocity, calculated as the area under the acceleration-time graph.
- VelocityThe speed of an object in a specific direction, calculated from the change in velocity when initial velocity is zero.
- RectangleA four-sided shape with opposite sides equal, used to calculate areas under the graph for velocity changes.
- TriangleA three-sided shape used to calculate areas under the graph, contributing to changes in velocity.
- BaseThe length of the bottom side of a shape, used in area calculations for rectangles and triangles.
- HeightThe vertical length from the base to the top of a shape, used in area calculations for rectangles and triangles.
- Positive AccelerationAcceleration that increases velocity, represented by areas above the time axis on the graph.
- Negative AccelerationAcceleration that decreases velocity, represented by areas below the time axis on the graph.
- Meters per SecondThe unit of measurement for velocity and change in velocity in the context of the graph.
- SymmetricalHaving balanced proportions, used to describe identical shapes on the graph for simplifying calculations.
- Initial VelocityThe starting speed of an object, often zero in problems involving acceleration-time graphs.
- Final VelocityThe speed of an object at a specific time, calculated by adding the change in velocity to the initial velocity.
- Time AxisThe horizontal axis on a graph representing time, used to determine intervals for area calculations.