2. 1D Motion / Kinematics
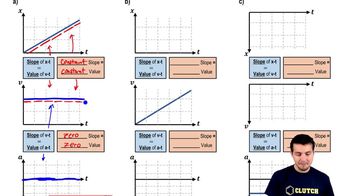
Graphing Position, Velocity, and Acceleration Graphs
Learn with other creators
Practice this topic
- Open Question
A police car at rest is passed by a speeder traveling at a constant 140 km/h. The police officer takes off in hot pursuit and catches up to the speeder in 850 m, maintaining a constant acceleration.
(a) Qualitatively plot the position vs. time graph for both cars from the police car's start to the catch-up point.
Calculate (b) how long it took the police officer to overtake the speeder,
320views1rank - Textbook Question
A police car at rest is passed by a speeder traveling at a constant 140 km/h. The police officer takes off in hot pursuit and catches up to the speeder in 850 m, maintaining a constant acceleration.
(a) Qualitatively plot the position vs. time graph for both cars from the police car's start to the catch-up point.
378views - Textbook QuestionDraw position, velocity, and acceleration graphs for the ball shown in FIGURE P2.44. See Problem 43 for more information.375views
- Textbook Question
III) Sketch the v vs. t graph for the object whose displacement as a function of time is given by Fig. 2–40.
<IMAGE>
86views - Multiple ChoiceWhich statement is the most accurate explanation of the information on a velocity-time graph?10views
- Multiple ChoiceWhat does a position vs. time graph with a constant positive slope indicate about the motion of an object?23views
- Multiple ChoiceWhich of the following best explains the data in a position-time graph where the line is a straight diagonal line with a positive slope?12views
- Multiple ChoiceIn a position-time graph, what information is typically presented on the y-axis?18views


