Velocity-Time Graphs & Acceleration
2. 1D Motion / Kinematics / Velocity-Time Graphs & Acceleration / Problem 2
An engineer claims to have made a very fast toy truck.
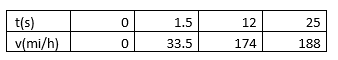
Do you think the acceleration is constant (make a sketch of a velocity-time graph of the toy's velocity (in m/s) as a function of time)? What is the average acceleration of the toy at (i) 0 and 1.5 s; (ii) 1.5 and 12 s (iii) 12 and 25 s?

Learn this concept