2. 1D Motion / Kinematics
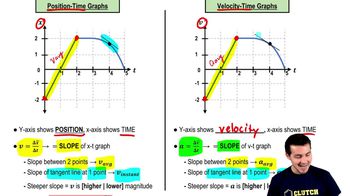
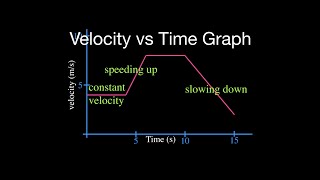
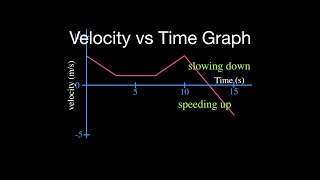
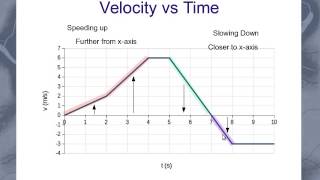
Velocity-Time Graphs & Acceleration
Problem 2a
Textbook Question
Textbook QuestionHigh-speed motion pictures (3500 frames/second) of a jumping, 210–μg flea yielded the data used to plot the graph in Fig. E2.54. (See 'The Flying Leap of the Flea' by M. Rothschild, Y. Schlein, K. Parker, C. Neville, and S. Sternberg in the November 1973 Scientific American.) This flea was about 2 mm long and jumped at a nearly vertical takeoff angle. Use the graph to answer these questions: (c) Find the flea's acceleration at 0.5 ms, 1.0 ms, and 1.5 ms.


 Verified Solution
This video solution was recommended by our tutors as helpful for the problem above
Video duration:
5m512
views
Was this helpful?
Related Videos
Related Practice
 05:59
05:59


Showing 1 of 7 videos