Ch. 02 - Describing Motion: Kinematics in One Dimension
Giancoli Douglas - Physics for Scientists and Engineers 5th edition
Giancoli Douglas5th editionPhysics for Scientists and EngineersISBN: 9780137488179Not the one you use?Change textbook
Chapter 2, Problem 102c

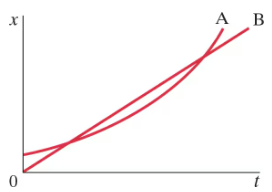
Figure 2–55 shows the position vs. time graph for two bicycles, A and B. At which instant(s) are the bicycles passing each other? Which bicycle is passing the other?
Position vs. time graph showing two bicycles, A and B, with lines indicating their motion and points of intersection.

Verified step by step guidance
1
Analyze the position vs. time graph provided in the problem. Identify the curves corresponding to bicycles A and B. Note that the point where the two curves intersect represents the instant(s) when the bicycles are at the same position (i.e., passing each other).
Determine the time coordinate(s) of the intersection point(s) on the graph. These time values indicate when the bicycles are passing each other.
To identify which bicycle is passing the other, observe the slopes of the curves (representing their velocities) at the intersection point(s). The slope is the derivative of the position with respect to time.
If the slope of bicycle A's curve is greater than that of bicycle B at the intersection point, bicycle A is overtaking bicycle B. Conversely, if the slope of bicycle B's curve is greater, bicycle B is overtaking bicycle A.
Summarize the findings: Specify the time(s) when the bicycles pass each other and indicate which bicycle is passing the other based on the slope analysis.

Verified video answer for a similar problem:

This video solution was recommended by our tutors as helpful for the problem above.
Was this helpful?

Key Concepts

Here are the essential concepts you must grasp in order to answer the question correctly.

Position vs. Time Graph

A position vs. time graph visually represents the location of an object over time. The x-axis typically denotes time, while the y-axis indicates position. The slope of the graph indicates the object's velocity; a steeper slope means a higher speed. When two objects' graphs intersect, it signifies that they are at the same position at that specific time.
Recommended video:
Guided course
03:04
Curved Position-Time Graphs & Acceleration

Relative Motion

Relative motion refers to the calculation of the motion of an object as observed from another moving object. In the context of the bicycles, understanding which bicycle is moving faster or slower relative to the other is crucial for determining which one is passing the other. This concept helps in analyzing how the position of one bicycle changes in relation to the other over time.
Recommended video:
Guided course
04:27
Intro to Relative Motion (Relative Velocity)

Intersection Points

Intersection points on a position vs. time graph indicate moments when two objects occupy the same position. To find when the bicycles pass each other, one must identify the time(s) at which their graphs intersect. This analysis reveals not only the instant of passing but also which bicycle is ahead or behind at that moment, providing insight into their relative speeds.
Recommended video:
Guided course
08:35
Angular Momentum of a Point Mass