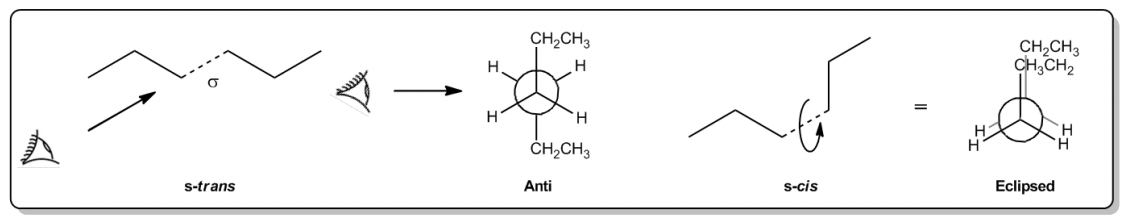
Now that we understand that sigma bonds are free to rotate as much as they want, it turns out that there's a unique way to visualize this rotation. And that visualization technique is called the Newman projection. Alright? So Newman projections are all about finding the different energy levels that conformers can make by rotating a sigma bond. Okay? So maybe you recognize this drawing. This drawing is the same drawing that I had before when I was talking about conformers and I was saying that you could have an S transhexane or an S cishexane. Okay? But it turns out that it's kind of difficult to visualize how those are different in energy. Energy is kind of an abstract concept right now. We haven't really defined it very well, but just think about it that if something is very high in energy, that's not going to make it very stable. Okay? So in this case, it's not easy to tell which one is lower energy and which one is higher energy and that's why we want to have a new way to visualize this. So what we say is, hey, imagine that your eyeball was right on this plane. So imagine that this is your face and this is your nose and those are your lips and obviously you're just an amazing looking dude. Wow. Okay. So I need to stop what I'm doing because that's really terrible looking. So imagine that that's a person. Don't imagine that's you. I don't want to get traumatized. And you're looking at that bond straight down the line, straight down that bond. What you would actually see is, you would see a carbon in the front. Let's say that's your red carbon. And you would also see a carbon in the back. Let's say that's your blue carbon. You would see them overlapping each other. You'd see one if you're looking right down that bond, you'd see one in the front, one in the back. So you would see that this would be your front one and then the one in the back would be represented by that circle. Okay? And basically what Newman projections allow you to do is to visualize, okay, where are the groups on the front carbon oriented and where are the groups in the back carbon oriented and how are they related to each other? And with Newman projections, you're allowed to rotate around that bond in a three-dimensional way. Okay? So basically, if you were to look down that bond, what you would see is that your big groups, this ethyl group here and this ethyl group here, would be on opposite sides of these carbons. Because as you can tell, if you were to draw your dotted line, they're on opposite sides of the fence. So basically, they'd be really far away from each other. Okay? But then if you look at Sis, Sis is different. Sis, if I had the same thing where my eyeball is looking, I would still see one in the front. Oh, just a second. Wow, red. I would still see one in the front and one in the back. But what I would also see is that now the big groups are overlapping each other. Okay? Instead of being on opposite sides, they're overlapping and that has a huge difference in how stable these molecules are, how stable these conformations are.
Newman Projections - Online Tutor, Practice Problems & Exam Prep
We use Newman projections to visualize the rotations of conformers. Some are more stable than others. Let's take a look.
How sigma bond rotation is visualized
Video transcript
So Newman projections are way of analyzing which sigma bond rotation will be the most stable. We have some rules about which rotations are better and which are worse!
Three Types of Conformations
The dihedral angle (theta), is equal to the angle between the two largest groups on either side of the projection.
The energy states of 3 different Newman Projections.
Video transcript
Let's go ahead and start off by defining what the dihedral angle is. The dihedral angle is defined by θ. So θ is just a variable that means angle. And what it does is it describes the rotation between the two largest groups relative to each other. So basically, the largest group in the front, on that front carbon, and the largest group on the back carbon, where they are relative to each other, that's going to tell you your dihedral angle. For example, if my two largest groups are overlapping each other perfectly, then the difference in their angle is 0 because as you go further around, your angle gets bigger. But they're overlapping, so the dihedral angle in this case would be 0 and this conformation is called eclipse. By the way, I just wanted to point out that there is a mistake on mine, how it says CH3. It should be CH2 and then CH3. So don't let that freak you out. If they're perfectly overlapping, that means that the dihedral angle is 0 and this conformation is called eclipse. The eclipsed conformation is the one where both of the groups overlap each other perfectly. This happens to be the conformation with the highest energy. Why would that be? Well, it turns out that large bulky groups don't like to be next to each other. Why? Because they feel crowded. Remember that big bulky groups, they don't just have atoms, they also have electrons and electrons are negative. So if you put a bunch of these electrons together, they're going to repel each other. So it's a really bad idea for these groups to overlap each other so perfectly. So this is going to be highest energy and what that means is lowest stability. So then let's look at the next one. The next one would be if the dihedral angle is 60 degrees. 60° degrees just means that they are not perfectly overlapping but they're also not perfectly far away. They're just kind of like, you know, maybe like 2 o'clock. At a 60° degree angle, that is going to be called Gauss. And Gauss is just you can say it's when they're adjacent to each other. They're not overlapping, but they're still not as far away as possible. So in this case, you see how it's visualized there. Now, this one is not amazing, but it's not as bad as the other one. So what I'm trying to say here is that the Gauss confirmation, it's not as unstable as eclipsed, but it's also not as good as it could be. So I'm just going to say here it has like middle energy. But middle meaning just that it's not as bad as eclipsed, so that would also mean kind of like middle stability. Cool. So now we're going to go on to our last one. Our last one is what if the dihedral angle is 180 degrees? That means that they're perfectly apart from each other. If they're perfectly apart from each other, that means that they're the furthest away they can get and that means this is going to be called anti or anti, the anti conformation. And the anti conformation is where your two largest groups are opposite, that one's going to be the lowest energy. And by lowest energy that would obviously mean most stable.

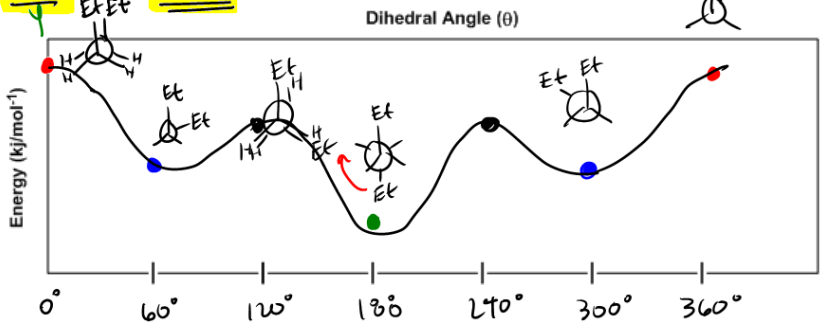
Plotting a Newman Energy Diagram
As you’ll see, when we plot (theta) against energy, we wind up getting a predictable pattern of peaks and valleys that can be used to better understand the different rotations.
How to draw a Newman Projection Energy Diagram.
Video transcript
What I want to do is I want to plot an energy diagram with these degrees, and I want to show you guys what that means and how that actually translates. Okay? Now, I know this is going to be your first interaction with an energy diagram or one of your first interactions, so I'm just going to explain how this works. Alright? Energy is on the y-axis over here and as you go up, you basically get less stable. Is that cool? And then on the x-axis, I'm going to have the dihedral angle. Okay? So I'm going to go ahead and start off at 0, 0 degrees and then I'm going to go by groups of 60. So I'm going to have 60, 120, 180, 240, 300, and then 360. Is that cool? Alright. So what I want to do is go ahead and start off; we don't have numbers, and I don't want you to worry about exact numbers. I just want to get a general pattern of what this is going to look like as it rotates. So basically, what I'm doing is I'm drawing a map of what the energy instability looks like as this bond rotates a full cycle or whatever. Okay? So let's go ahead and start off with 0. 0 degrees is what kind of energy? Is it the highest, lowest, middle? What is it? Zero degrees is eclipsed. That means that they're perfectly overlapped, which means that this is going to be the highest energy. So I want to pick a point that's really high on my energy diagram. Do I need to know exactly what energy? No. I just want to pick a high point. Is that cool? Now let's look at 60 degrees. 60 degrees would be gauche. We said that gauche is more stable than eclipse. So what I should do is I should pick a spot that's lower. So I'm going to pick a spot like right here. Alright? So that means that as I rotate from 0 to 60, I'm getting better. My energy is getting less, which means that I am also getting more stable. Is that cool? Alright. So then we go to 120. Okay? Well, actually, let's go to 180 first since that's the one that we have plotted out and then we'll do the 120. Okay. So for 180, 180 would be that they're perfectly far apart, which means that they are the most stable they can be. So at 180, where should I plot that point? I should plot that point at the lowest point of my graph. That's going to be the most stable point on my graph. Alright? Cool. So then let's go ahead and plot these again if we kept going. So if I basically added another 120 degrees, I would get back to the 60-degree spot, but I would get to the 60-degree spot the other way. And then finally, after 360 degrees, I would get back to a full cycle where they're overlapping again. So then I would pick a high spot. Okay? Now I know that it's difficult to visualize what maybe that second blue spot looked like, so I'll actually draw it. So remember that this first red one would just be like this. It would be, let's say you have X and X and they're overlapping. Okay? So that would be our and then you have basically all these are like H's. Okay? I'm just writing X because I don't want to draw the entire thing. Okay? Actually yeah, that's fine. Well actually, it says here to plot down the C3 C4 bond of hexane. What does that mean? We should actually talk about that. I'm sorry I forgot to mention that. Okay. What that means is that they want us to show down the bond of the 3rd carbon and the 4th carbon what the different energy levels would be. Notice that what's coming off of the first half would be an ethyl group and what's coming off of the second half would be an ethyl group as well. Because the 2 in the middle are the part that is in the Newman projection. Those 2 are the front and the back of the Newman projection. Okay? So what that means is that I could just instead of writing XX, I could just write ETEt, where Et stands for ethyl. Okay? And that's actually a really common abbreviation of ethyl is just to write Et. Okay? Now, let's go down to 60. 60 would mean that now one of the ethyls is still facing the top, but now the other ethyl is to the side. Does that make sense? Cool. So now they're a little bit more stable. Then 180 would mean that one ethyl is facing up, and one ethyl is facing down. Okay? Well then, where am I getting this other blue spot from? Well, the other blue spot would be if I just continued rotating this, what I would eventually get is that this Et is still at the top but then now this Et just got 60 degrees away again, but now it's on the other side. And then finally, this one would be if the Et's overlap again. Alright? So now you're probably wondering about the one twenties. The one twenties don't have a name that we use often in organic chemistry, but you could imagine that what's happening is that at the one twenties, I'm going to get an Et here and then I'm also going to get an Et here, overlapping with an H. Hh. So that means that for one twenties, everything is overlapping again. Okay? So that means this is actually going to be a higher energy point. So this one would actually be up here somewhere. And then this one would be up here somewhere. Okay? So now we've finally got our energy diagram. All we have to do is connect the dots. And when we connect the dots, we're going to get something that looks like this. Basically, down here, then up, then down, then up, then down, and then back up. Okay? And that is your energy diagram as you rotate along the bond. What that basically says is that you start off at the worst spot, then you go 60 degrees, and it gets a lot better. Then you go 120 degrees, and it gets worse again. Then you go 180, and it gets the best. Then you come back and do 240, and that's pretty bad because everything's overlapping. Then you do 300, and that is a little bit better than 240 because now things are staggered. And then finally, 360 is the same as 0. Okay. I know it looks silly with me doing the whole clock thing, but hopefully, that helps you guys relate to this diagram. Now the reason I went into such depth with this diagram is that some professors want you to be able to draw this or at least recognize what's going on with these dihedral angle diagrams. Okay? So I just want you guys to understand that hopefully, now you should easily know that anti is the best, eclipsed is the worst, and gauche is in the middle. And you should also be familiar with their dihedral angles.
Professors may ask you to draw this, so don’t just tune it out! You need to understand the basics of energy diagrams for this topic.
Do you want more practice?
More setsYour Organic Chemistry tutors


- Which of the following conformers of isobutyl chloride is the most stable?
- 1. Construct a graph, similar to [FIGURE 3-11] , of the torsional energy of 3-methylpentane along the C2―C3 bo...
- Draw a graph, similar to [FIGURE 3-11] , of the torsional energy of 2-methylbutane as it rotates about the C2—...
- a. Draw a graph, similar to [FIGURE-9] , of the torsional strain of 2-methylpropane as it rotates about the bo...
- The chair conformer of fluorocyclohexane is 0.25 kcal/mol more stable when the fluoro substituent is in an equ...
- Calculate the dihedral angle (θ) for the conformations shown. (a)
- Calculate the dihedral angle (θ) for the conformations shown. (c)
- For each of the pairs in Assessment 3.29, which conformation would you expect to be more prominent at equilibr...
- Choose the conformation in each pair that is most stable. If both are equally stable, then write 'no differenc...
- (••••) LOOKING AHEAD In Chapter 5, we introduce reaction coordinate diagrams as a plot of potential energy ver...
- Which conformation in each of the following pairs has the least strain energy? (c)
- 5. Indicate which conformations are the most stable (lowest energy) and the least stable (highest energy).
- Why is it incorrect to say that the dihedral angle shown is 120° or even 109°?<IMAGE>
- (••) For each pair of conformations shown, choose which is most stable. [If both conformations have the same n...
- (••) For each pair of conformations shown, choose which is most stable. [If both conformations have the same n...
- Which of the following structures represent the same compound? Which ones represent different compounds? f. &...
- Construct a graph, similar to [FIGURE 3-11] <IMAGE>, of the torsional energy of 3-methylpentane along th...
- Calculate the dihedral angle (θ) for the conformations shown.(c) <IMAGE>