0. Basic Principles of Economics
Graphing Review
0. Basic Principles of Economics
Graphing Review

 04:34
04:34


Showing 10 of 10 videos
Additional 37 creators.
Learn with other creators


Showing 40 of 40 videos
Practice this topic
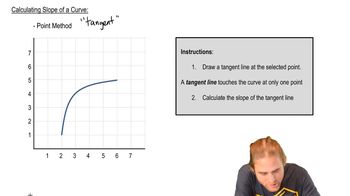
- Open Question
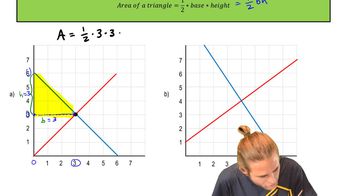
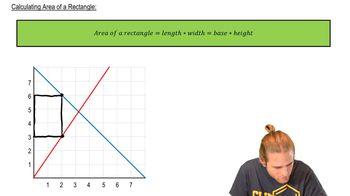
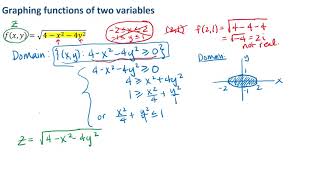
Calculate the area of the shaded region.
578views11rank - Multiple ChoiceWhich of the following letters on the graph represents the ON RRP (Overnight Reverse Repurchase Agreement) offering rate?84views
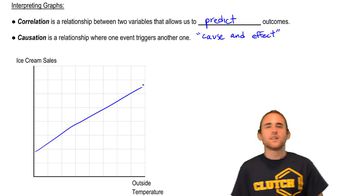
- Multiple ChoiceWhich of the following statements can be inferred from at least one of the graphs shown in a typical microeconomics graphing review?95views
- Multiple ChoiceWhich of the following graphs in Figure 1 illustrates the behavior of a total fixed cost?124views
- Multiple ChoiceWhich phrase best describes the graph of a proportional relationship?85views