Alright, so I've got a big practice problem here, let's just dive right in. Suppose the USA currently both produces and imports wacky waving inflatable arm flailing tube men. The government decides to restrict international trade by imposing a quota that limits the import of wacky wavy inflatable arm flailing tube men to 4,000 units. The figure shows the results of the quota. Fill in the following table using the data in the figure. Alright. So we've got an import quota of 4,000 units, and we've got a graph here, with a bunch of information. So let's go ahead and start seeing what they're asking us here in this question. They're going to ask us a bunch of information, right, without the quota and with the quota, what changes? So let's start here with the world price. What is going to be the world price with and without the quota? So without the quota, we've got this low price, right? As we've seen, there's going to be this low price in the market and that's going to be our world price, right? That's the world price and what the quota is going to do is essentially increase that price a little bit, right? So we know that the lower of the 2 is going to be the world price. So the world price here without the quota is going to be $10. How about with the quota? Well, it's still going to be $10, right? The price everywhere else, everywhere in the world is $10. It's just in our market, in our USA market here that we're going to be affecting that price. So what are we going to see is what's going to be the USA price without the quota? Well, without the quota, we're going to see that we're at that $10, right? The USA price is going to equal the world price without the quota, but now when we add the quota, we're going to increase essentially the price is going to find its way up to here, right, because of the quota. There's going to be less imports, it's going to restrict trade a little bit, it's going to cause that price to increase. Alright? So what do we see? With the quota, the US price has gone up to $12, right? So let's go on to the next one here. It's asking us quantity supplied by US firms. Alright? So the quantity supplied by the US firms without the quota, it's going to be where that price, the world price, touches the supply curve. So here we've got our supply curve. Let me do it in a different color. And we've got this point right here, right? The world price touches the supply curve right there and we see that that's at a quantity supplied of 6,000 units, right? So that's going to be the quantity supplied without the quota. So quantity supplied without the quota is going to be 6,000 units, right? And what's going to happen with the quota? Well, when we do add the quota in, it's going to essentially get us to this higher price, the $12, right? So what are US producers going to put on the market at $12? Well, it's where it touches the supply curve, right? So the $12 touches the supply curve right there, and we're going to see that the quantity supplied with the quota, I'm going to put a q there for the quota, has gone up to 10,000. Right? And that's because there's a higher price, so they're willing to put more units out there. So 10,000 units is going to be the quantity supplied, with the quota. How about the quantity demanded by US consumers without the quota first? So without the quota just in the same way, we're going to be at that world price. Right? So without the quota, the demand curve touches the world price way out here, and we're going to see that this is going to be the quantity demanded domestically, right, without the quota. They're going to be demanding 16,000 units, And what's going to happen after the quota? Well, we're going to move to this other point, right? It's where it touches the $12 line. The demand curve touches the $12 line right there, and that's at 14,000 units. So that's the quantity demanded with the quota. Right? So we've got 14,000 units there, and what do we see in the middle of here? Right? So if we look right in between the 10,000 and the 14,000 right, the difference between these, that's the amount of the quota. It told us above that the import quota, was 4,000 units, right. It told us that, the government's going to set a quota of 4,000 units and that's exactly what we see here, right? That's the distance between the quantity demanded and quantity supplied with the quota. So let's go ahead and see the quantity imported. So quantity imported without the quota, right, that's going to be the difference between the quantity demanded and quantity supplied without the quota. So what was our quantity demanded and quantity supplied without the quota? Well, it was this 16,000, was the quantity demanded, right, minus the quantity supplied was 6,000. So the difference there of 10,000 is going to be the amount of imports when we didn't have a quota. Alright. So that's going to be 10,000 units being imported without the quota and that makes sense. Right? If we look at without the quota, the quantity supplied without the quota by US firms right here and the quantity demanded right here of 16,000, well that 10,000 is going to fill the gap of the two numbers, right, And that's going to be the imports. So let's look at imports with the quota and just like we said, there's a quota of 4,000, right? And that's what we see is the difference between the coin demanded and quantity supplied with the quota. 14,000 minus 10,000. That's going to give us that quantity imported which is equal to our import quota of 4,000 units and again, you can see here that the difference between the quantity supplied by US firms and by US consumers is equal to that quota. Right? That 4,000 fills that gap. Alright, cool. So let's go on to the next one and talk about the area of consumer surplus. So what was the area of consumer surplus without the quota? So without the quota, it's everything above the price, right, which the price was $10 in that situation, but below the demand curve, and that's going to give us this big triangle here that includes everything a, b, c, d, e, and F. Right. It includes all of those regions. So our consumer surplus without the quota, I'm going to say area of a plus b plus c plus d plus e plus f. Right? They have all of those sections. Now what about without the quota or excuse me, with the quota? So I'm going to erase all that. With the quota, we've got this higher price. Right? So we're going to see that consumer surplus is everything above that price of 12, but under the demand curve, and we're going to get this big region right here, a plus b. Right? So they've lost that section cdef and all that's left is that a plus b. So the consumer surplus has decreased, right, and that's what we expect with an import quota, and we've got a consumer surplus of a+b. How about the domestic producer surplus? So we're talking only about the domestic producers and before, before the quota, right, right, without the quota, what was their surplus? Their surplus was just this section g, right, because it's everything below the price but above the supply curve. It was just g without_the_quota. Alright? And what about with the quota? Well, now we've got a higher price, right? So they're able to capture a little more surplus. So it's still going to have g but it's going to include this section C as well, right? Because that's under the price and above the supply curve. Cool. So that area right there is going to be c+g. Right? So they've gotten that extra bit of surplus because of the higher price.
Table of contents
- 0. Basic Principles of Economics1h 5m
- Introduction to Economics3m
- People Are Rational2m
- People Respond to Incentives1m
- Scarcity and Choice2m
- Marginal Analysis9m
- Allocative Efficiency, Productive Efficiency, and Equality7m
- Positive and Normative Analysis7m
- Microeconomics vs. Macroeconomics2m
- Factors of Production5m
- Circular Flow Diagram5m
- Graphing Review10m
- Percentage and Decimal Review4m
- Fractions Review2m
- 1. Reading and Understanding Graphs59m
- 2. Introductory Economic Models1h 10m
- 3. The Market Forces of Supply and Demand2h 26m
- Competitive Markets10m
- The Demand Curve13m
- Shifts in the Demand Curve24m
- Movement Along a Demand Curve5m
- The Supply Curve9m
- Shifts in the Supply Curve22m
- Movement Along a Supply Curve3m
- Market Equilibrium8m
- Using the Supply and Demand Curves to Find Equilibrium3m
- Effects of Surplus3m
- Effects of Shortage2m
- Supply and Demand: Quantitative Analysis40m
- 4. Elasticity2h 26m
- Percentage Change and Price Elasticity of Demand19m
- Elasticity and the Midpoint Method20m
- Price Elasticity of Demand on a Graph11m
- Determinants of Price Elasticity of Demand6m
- Total Revenue Test13m
- Total Revenue Along a Linear Demand Curve14m
- Income Elasticity of Demand23m
- Cross-Price Elasticity of Demand11m
- Price Elasticity of Supply12m
- Price Elasticity of Supply on a Graph3m
- Elasticity Summary9m
- 5. Consumer and Producer Surplus; Price Ceilings and Floors3h 45m
- Consumer Surplus and Willingness to Pay38m
- Producer Surplus and Willingness to Sell26m
- Economic Surplus and Efficiency18m
- Quantitative Analysis of Consumer and Producer Surplus at Equilibrium28m
- Price Ceilings, Price Floors, and Black Markets38m
- Quantitative Analysis of Price Ceilings and Price Floors: Finding Points20m
- Quantitative Analysis of Price Ceilings and Price Floors: Finding Areas54m
- 6. Introduction to Taxes and Subsidies1h 46m
- 7. Externalities1h 12m
- 8. The Types of Goods1h 13m
- 9. International Trade1h 16m
- 10. The Costs of Production2h 35m
- 11. Perfect Competition2h 23m
- Introduction to the Four Market Models2m
- Characteristics of Perfect Competition6m
- Revenue in Perfect Competition14m
- Perfect Competition Profit on the Graph20m
- Short Run Shutdown Decision33m
- Long Run Entry and Exit Decision18m
- Individual Supply Curve in the Short Run and Long Run6m
- Market Supply Curve in the Short Run and Long Run9m
- Long Run Equilibrium12m
- Perfect Competition and Efficiency15m
- Four Market Model Summary: Perfect Competition5m
- 12. Monopoly2h 13m
- Characteristics of Monopoly21m
- Monopoly Revenue12m
- Monopoly Profit on the Graph16m
- Monopoly Efficiency and Deadweight Loss20m
- Price Discrimination22m
- Antitrust Laws and Government Regulation of Monopolies11m
- Mergers and the Herfindahl-Hirschman Index (HHI)17m
- Four Firm Concentration Ratio6m
- Four Market Model Summary: Monopoly4m
- 13. Monopolistic Competition1h 9m
- 14. Oligopoly1h 26m
- 15. Markets for the Factors of Production1h 33m
- The Production Function and Marginal Revenue Product16m
- Demand for Labor in Perfect Competition7m
- Shifts in Labor Demand13m
- Supply of Labor in Perfect Competition7m
- Shifts in Labor Supply5m
- Differences in Wages6m
- Discrimination6m
- Other Factors of Production: Land and Capital5m
- Unions6m
- Monopsony11m
- Bilateral Monopoly5m
- 16. Income Inequality and Poverty35m
- 17. Asymmetric Information, Voting, and Public Choice39m
- 18. Consumer Choice and Behavioral Economics1h 16m
9. International Trade
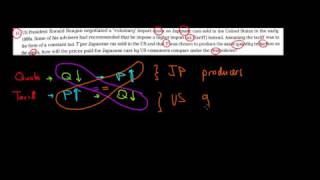
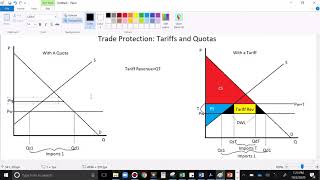
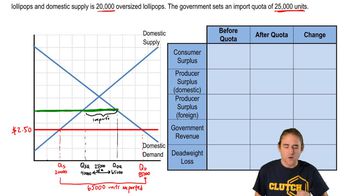
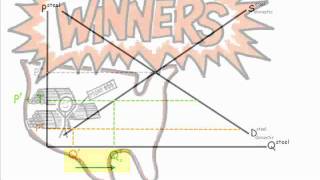
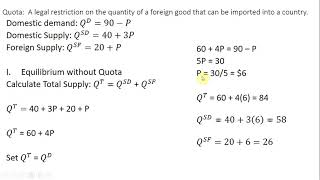
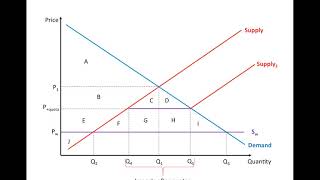
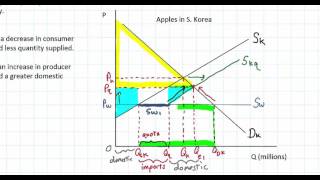
Import Quotas and VERs
Video duration:
9mPlay a video:
Related Videos