So now let's see how elasticity changes along a linear demand curve. A lot of students trip up and they tend to think that slope and elasticity are the same thing. Although they are slightly related, they are not the same, right? Slope is a ratio of changes between two variables where we're in a certain unit, but elasticity is a ratio of percentage changes, right? We've got percentage changes and that little word 'percentages' there makes a huge difference between the two definitions. So let's go over to this purple box where I can maybe show you an example of what's happening. When we have a price of $1 and we increase it to $2, what was our unit change in that situation? Well, we went from 1 to 2, we increased by 1, right? We increased by $1 there. But what was our percentage change? We started at 1; whoa, calm down, okay, we started at 1 and now we're at 2. We doubled our value, right? We started at 1 and doubled it up to 2. So our percentage change in that situation was 100%. We increased it by 100% from 1 to 2. And how about this second situation? We were at a price of 2 and now we increased it to 3. Again, we have a unit change of 1, right? We just increased it by $1 there, but what about our percentage change this time? It's not 100 percent, right? We didn't double it again. We actually only had increased it by half of the amount. We went from 2 to 3; we only increased it by 1, which is half of 2. So in that situation, our percentage change was just 50%, right, and that's because the numbers got bigger, right? So, you could imagine from 3 to 4, we're still going to have a unit change of 1 but a smaller percentage change; 4 to 5, percentage change smaller. So you're going to see that even though the linear curve shows a constant change of 1 unit at a time, we're having different percentage changes every time, right? So, even if you don't get everything on a really deep level there, just at least understand that we do have a difference here between slope and elasticity. Cool? So let's go ahead and go on to this graph where we've got a linear demand curve and I just want to cut to the chase real quick. When we've got a linear demand curve, we're going to have sections of the line that are elastic, sections of the line that are inelastic, and a point on the line that's going to be unit elastic, alright? And that unit elastic point is going to be the point where we want to produce and it's the point where revenue is maximized, okay? So I'm just going to cut all through the crap here and I'm just going to go straight to it. So right here, this section here to the left of the middle, right? So when you connect your demand curve from one axis to the other like we have here, it's touching the price axis, it's touching the quantity axis, you just go to the middle point, right? Right here is the middle and you can visualize that very easily. Where's the middle of that line? Right there. So to the left of that middle point, which in that middle I'm going to highlight in green, right, to the left of that middle point, we are going to have elastic demand and to the right of that point. What do you guys think? Yep. I heard someone. It's inelastic on that side of the point. Now here's the real kicker. Do you guys think at that specific point what are we dealing with? Yep. Unit elastic is at that point right in the middle and at that unit elastic point just like I said, that's where we wanna produce and that's where revenue is maximized. So let's go ahead and go to this table right here where we've got the prices and quantities demanded, which are shown on that line on the graph. Okay? So I've gone ahead and taken these points and plotted them on the graph right there. Let's go ahead and calculate our total revenue in each of these cases. So total revenue, remember, is just price times quantity. So all we've got to do is just multiply across here. So price times quantity, 0. 7 times 2, 14. It looks like we're doing our multiplication tables here again so you could journey back to arithmetic, but let's go ahead and fill out this table. 34 times 8. 32. Right. So I'm just multiplying across price times quantity and there we go. We've got all our total revenues. So you'll notice what's happening, right? We started with a revenue of 0 when we had a price of 8 and no quantity demanded. And as we lowered the price and people started to demand quantity, our revenue went up, up, up to a point and then it started to fall again, right? Once we passed that point, the price started to fall again and what did we see at that point where it was 48, right? That's that point right in the middle that we were just talking about. So at a price of 4, the quantity of 8, that's our unit elastic point, that is where revenue is maximized. Easy enough, right? I didn't want to over complicate it because this is kind of just the way to think about it. You're going to connect your line to the two axes and you're going to find that middle point on the line. So easy. So let's go ahead and take this same data and make a graph here. So this first graph, right, we had our price and our quantity. The graph that we're used to. But check out this second graph. I've got our total revenue rather than price on the y-axis. So we've got total revenue versus quantity here and just like we saw in our schedule, the total revenue is going to increase up to a point and then decrease again, right? So notice during this first section that's where we're elastic. In that section, that is where the quantity demanded, the percentage of quantity demanded is increasing faster than the price is decreasing. So that's why our revenue is going up. The quantity demanded is going up faster than the price, and the opposite is happening in the inelastic part after it starts decreasing again. There the price decreases are bigger than the quantity increases, so we're losing revenue again. Alright, so long story short right, we just want to find that middle point most of the time. We just want to remember the left of that point is elastic, the right of that point is inelastic, and at that point is unit elastic and that's what I've got here at the bottom, right? This is our little summary. We've got demand is elastic to the left of the middle. Demand is unit elastic at the middle. Let me do a little better, and inelastic to the right of the middle. It's as easy as that. Let's go ahead and move on.
4. Elasticity
Total Revenue Along a Linear Demand Curve
4. Elasticity
Total Revenue Along a Linear Demand Curve - Online Tutor, Practice Problems & Exam Prep
1
concept
Total Revenue Along a Linear Demand Curve
Video duration:
7mVideo transcript
2
Problem
ProblemUse this graph to answer the following questions.
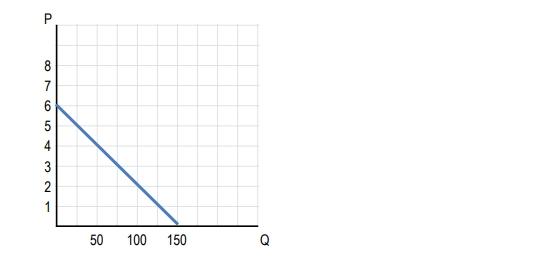
What is the elasticity of demand when the price of the good changes from $3 to $5?
A
0.25
B
0.50
C
1.00
D
2.00
3
Problem
ProblemUse this graph to answer the following questions.

At what price is the elasticity of demand for the product equal to one?
A
$2
B
$3
C
$4
D
$5
4
Problem
ProblemUse this graph to answer the following questions.

At what price is revenue maximized?
A
$2
B
$3
C
$4
D
$5
