So now let's see how elasticity changes along a linear demand curve. A lot of students trip up and they tend to think that slope and elasticity are the same thing. Although they are slightly related, they are not the same, right? Slope is a ratio of changes between two variables where we're in a certain unit, but elasticity is a ratio of percentage changes, right? We've got percentage changes and that little word 'percentages' there makes a huge difference between the two definitions. So let's go over to this purple box where I can maybe show you an example of what's happening. When we have a price of $1 and we increase it to $2, what was our unit change in that situation? Well, we went from 1 to 2, we increased by 1, right? We increased by $1 there. But what was our percentage change? We started at 1; whoa, calm down, okay, we started at 1 and now we're at 2. We doubled our value, right? We started at 1 and doubled it up to 2. So our percentage change in that situation was 100%. We increased it by 100% from 1 to 2. And how about this second situation? We were at a price of 2 and now we increased it to 3. Again, we have a unit change of 1, right? We just increased it by $1 there, but what about our percentage change this time? It's not 100 percent, right? We didn't double it again. We actually only had increased it by half of the amount. We went from 2 to 3; we only increased it by 1, which is half of 2. So in that situation, our percentage change was just 50%, right, and that's because the numbers got bigger, right? So, you could imagine from 3 to 4, we're still going to have a unit change of 1 but a smaller percentage change; 4 to 5, percentage change smaller. So you're going to see that even though the linear curve shows a constant change of 1 unit at a time, we're having different percentage changes every time, right? So, even if you don't get everything on a really deep level there, just at least understand that we do have a difference here between slope and elasticity. Cool? So let's go ahead and go on to this graph where we've got a linear demand curve and I just want to cut to the chase real quick. When we've got a linear demand curve, we're going to have sections of the line that are elastic, sections of the line that are inelastic, and a point on the line that's going to be unit elastic, alright? And that unit elastic point is going to be the point where we want to produce and it's the point where revenue is maximized, okay? So I'm just going to cut all through the crap here and I'm just going to go straight to it. So right here, this section here to the left of the middle, right? So when you connect your demand curve from one axis to the other like we have here, it's touching the price axis, it's touching the quantity axis, you just go to the middle point, right? Right here is the middle and you can visualize that very easily. Where's the middle of that line? Right there. So to the left of that middle point, which in that middle I'm going to highlight in green, right, to the left of that middle point, we are going to have elastic demand and to the right of that point. What do you guys think? Yep. I heard someone. It's inelastic on that side of the point. Now here's the real kicker. Do you guys think at that specific point what are we dealing with? Yep. Unit elastic is at that point right in the middle and at that unit elastic point just like I said, that's where we wanna produce and that's where revenue is maximized. So let's go ahead and go to this table right here where we've got the prices and quantities demanded, which are shown on that line on the graph. Okay? So I've gone ahead and taken these points and plotted them on the graph right there. Let's go ahead and calculate our total revenue in each of these cases. So total revenue, remember, is just price times quantity. So all we've got to do is just multiply across here. So price times quantity, 0. 7 times 2, 14. It looks like we're doing our multiplication tables here again so you could journey back to arithmetic, but let's go ahead and fill out this table. 34 times 8. 32. Right. So I'm just multiplying across price times quantity and there we go. We've got all our total revenues. So you'll notice what's happening, right? We started with a revenue of 0 when we had a price of 8 and no quantity demanded. And as we lowered the price and people started to demand quantity, our revenue went up, up, up to a point and then it started to fall again, right? Once we passed that point, the price started to fall again and what did we see at that point where it was 48, right? That's that point right in the middle that we were just talking about. So at a price of 4, the quantity of 8, that's our unit elastic point, that is where revenue is maximized. Easy enough, right? I didn't want to over complicate it because this is kind of just the way to think about it. You're going to connect your line to the two axes and you're going to find that middle point on the line. So easy. So let's go ahead and take this same data and make a graph here. So this first graph, right, we had our price and our quantity. The graph that we're used to. But check out this second graph. I've got our total revenue rather than price on the y-axis. So we've got total revenue versus quantity here and just like we saw in our schedule, the total revenue is going to increase up to a point and then decrease again, right? So notice during this first section that's where we're elastic. In that section, that is where the quantity demanded, the percentage of quantity demanded is increasing faster than the price is decreasing. So that's why our revenue is going up. The quantity demanded is going up faster than the price, and the opposite is happening in the inelastic part after it starts decreasing again. There the price decreases are bigger than the quantity increases, so we're losing revenue again. Alright, so long story short right, we just want to find that middle point most of the time. We just want to remember the left of that point is elastic, the right of that point is inelastic, and at that point is unit elastic and that's what I've got here at the bottom, right? This is our little summary. We've got demand is elastic to the left of the middle. Demand is unit elastic at the middle. Let me do a little better, and inelastic to the right of the middle. It's as easy as that. Let's go ahead and move on.
- 1. Introduction to Macroeconomics1h 57m
- 2. Introductory Economic Models59m
- 3. Supply and Demand3h 43m
- Introduction to Supply and Demand10m
- The Basics of Demand7m
- Individual Demand and Market Demand6m
- Shifting Demand44m
- The Basics of Supply3m
- Individual Supply and Market Supply6m
- Shifting Supply28m
- Big Daddy Shift Summary8m
- Supply and Demand Together: Equilibrium, Shortage, and Surplus10m
- Supply and Demand Together: One-sided Shifts22m
- Supply and Demand Together: Both Shift34m
- Supply and Demand: Quantitative Analysis40m
- 4. Elasticity2h 26m
- Percentage Change and Price Elasticity of Demand19m
- Elasticity and the Midpoint Method20m
- Price Elasticity of Demand on a Graph11m
- Determinants of Price Elasticity of Demand6m
- Total Revenue Test13m
- Total Revenue Along a Linear Demand Curve14m
- Income Elasticity of Demand23m
- Cross-Price Elasticity of Demand11m
- Price Elasticity of Supply12m
- Price Elasticity of Supply on a Graph3m
- Elasticity Summary9m
- 5. Consumer and Producer Surplus; Price Ceilings and Price Floors3h 40m
- Consumer Surplus and WIllingness to Pay33m
- Producer Surplus and Willingness to Sell26m
- Economic Surplus and Efficiency18m
- Quantitative Analysis of Consumer and Producer Surplus at Equilibrium28m
- Price Ceilings, Price Floors, and Black Markets38m
- Quantitative Analysis of Price Ceilings and Floors: Finding Points20m
- Quantitative Analysis of Price Ceilings and Floors: Finding Areas54m
- 6. Introduction to Taxes1h 25m
- 7. Externalities1h 3m
- 8. The Types of Goods1h 13m
- 9. International Trade1h 16m
- 10. Introducing Economic Concepts49m
- Introducing Concepts - Business Cycle7m
- Introducing Concepts - Nominal GDP and Real GDP12m
- Introducing Concepts - Unemployment and Inflation3m
- Introducing Concepts - Economic Growth6m
- Introducing Concepts - Savings and Investment5m
- Introducing Concepts - Trade Deficit and Surplus6m
- Introducing Concepts - Monetary Policy and Fiscal Policy7m
- 11. Gross Domestic Product (GDP) and Consumer Price Index (CPI)1h 37m
- Calculating GDP11m
- Detailed Explanation of GDP Components9m
- Value Added Method for Measuring GDP1m
- Nominal GDP and Real GDP22m
- Shortcomings of GDP8m
- Calculating GDP Using the Income Approach10m
- Other Measures of Total Production and Total Income5m
- Consumer Price Index (CPI)13m
- Using CPI to Adjust for Inflation7m
- Problems with the Consumer Price Index (CPI)6m
- 12. Unemployment and Inflation1h 22m
- Labor Force and Unemployment9m
- Types of Unemployment12m
- Labor Unions and Collective Bargaining6m
- Unemployment: Minimum Wage Laws and Efficiency Wages7m
- Unemployment Trends7m
- Nominal Interest, Real Interest, and the Fisher Equation10m
- Nominal Income and Real Income12m
- Who is Affected by Inflation?5m
- Demand-Pull and Cost-Push Inflation6m
- Costs of Inflation: Shoe-leather Costs and Menu Costs4m
- 13. Productivity and Economic Growth1h 17m
- 14. The Financial System1h 37m
- 15. Income and Consumption52m
- 16. Deriving the Aggregate Expenditures Model1h 22m
- 17. Aggregate Demand and Aggregate Supply Analysis1h 18m
- 18. The Monetary System1h 1m
- The Functions of Money; The Kinds of Money8m
- Defining the Money Supply: M1 and M24m
- Required Reserves and the Deposit Multiplier8m
- Introduction to the Federal Reserve8m
- The Federal Reserve and the Money Supply11m
- History of the US Banking System9m
- The Financial Crisis of 2007-2009 (The Great Recession)10m
- 19. Monetary Policy1h 32m
- 20. Fiscal Policy1h 0m
- 21. Revisiting Inflation, Unemployment, and Policy46m
- 22. Balance of Payments30m
- 23. Exchange Rates1h 16m
- Exchange Rates: Introduction14m
- Exchange Rates: Nominal and Real13m
- Exchange Rates: Equilibrium6m
- Exchange Rates: Shifts in Supply and Demand11m
- Exchange Rates and Net Exports6m
- Exchange Rates: Fixed, Flexible, and Managed Float5m
- Exchange Rates: Purchasing Power Parity7m
- The Gold Standard4m
- The Bretton Woods System6m
- 24. Macroeconomic Schools of Thought40m
- 25. Dynamic AD/AS Model35m
- 26. Special Topics11m
Total Revenue Along a Linear Demand Curve: Study with Video Lessons, Practice Problems & Examples
 Created using AI
Elasticity differs from slope; while slope measures unit changes, elasticity measures percentage changes. On a linear demand curve, demand is elastic to the left of the midpoint, unit elastic at the midpoint, and inelastic to the right. Revenue maximization occurs at the unit elastic point, where total revenue increases with price decreases until reaching this point, then declines. Understanding these concepts is crucial for analyzing consumer behavior and market dynamics, particularly in relation to aggregate demand and supply.
Total Revenue Along a Linear Demand Curve
Video transcript
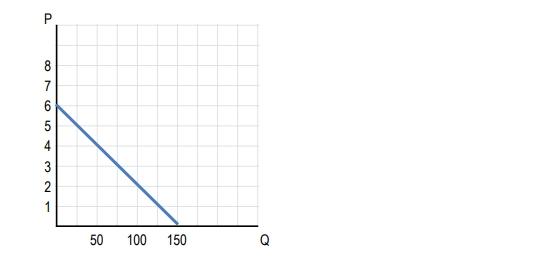
Use this graph to answer the following questions.
What is the elasticity of demand when the price of the good changes from $3 to $5?
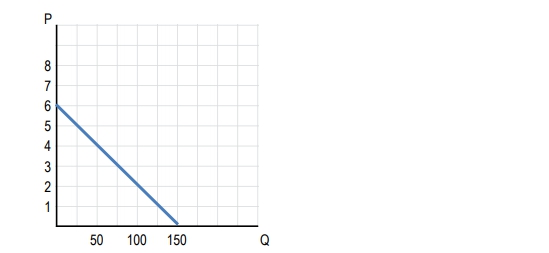
Use this graph to answer the following questions.
At what price is the elasticity of demand for the product equal to one?
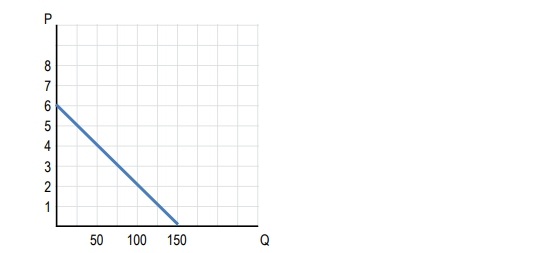
Use this graph to answer the following questions.
At what price is revenue maximized?
Here’s what students ask on this topic:
What is the difference between slope and elasticity on a linear demand curve?
Slope and elasticity are often confused but are distinct concepts. The slope of a demand curve measures the ratio of unit changes between two variables, typically price and quantity. It is calculated as the change in quantity divided by the change in price. Elasticity, on the other hand, measures the ratio of percentage changes. It is calculated as the percentage change in quantity demanded divided by the percentage change in price. This distinction is crucial because elasticity can vary along a linear demand curve, even though the slope remains constant. Elasticity provides a better understanding of consumer responsiveness to price changes.
 Created using AI
How does total revenue change along a linear demand curve?
Total revenue (TR) is calculated as price (P) times quantity (Q). Along a linear demand curve, TR changes in a predictable pattern. Initially, as price decreases, TR increases because the percentage increase in quantity demanded is greater than the percentage decrease in price (elastic region). At the midpoint of the demand curve, demand is unit elastic, and TR is maximized. Beyond this point, further decreases in price lead to a smaller percentage increase in quantity demanded, causing TR to decline (inelastic region). Understanding this relationship helps in identifying the optimal price point for maximizing revenue.
 Created using AI
What is the significance of the unit elastic point on a linear demand curve?
The unit elastic point on a linear demand curve is significant because it represents the price and quantity combination where total revenue is maximized. At this point, the percentage change in quantity demanded is exactly equal to the percentage change in price, resulting in no net change in total revenue. This point divides the demand curve into two regions: elastic (left of the midpoint) and inelastic (right of the midpoint). Understanding the unit elastic point is crucial for businesses aiming to optimize pricing strategies to maximize revenue.
 Created using AI
How do you calculate total revenue at different points on a linear demand curve?
To calculate total revenue (TR) at different points on a linear demand curve, you multiply the price (P) by the quantity demanded (Q) at each point. For example, if the price is $4 and the quantity demanded is 8 units, the total revenue is calculated as:
By repeating this calculation for different price-quantity combinations, you can determine how total revenue changes along the demand curve. This helps in identifying the point where revenue is maximized.
 Created using AI
Why is understanding elasticity important for analyzing consumer behavior?
Understanding elasticity is crucial for analyzing consumer behavior because it measures how responsive consumers are to changes in price. Elasticity helps businesses and policymakers predict how changes in price will affect the quantity demanded. For example, if demand is elastic, a small decrease in price will lead to a large increase in quantity demanded, potentially increasing total revenue. Conversely, if demand is inelastic, a price decrease will result in a smaller increase in quantity demanded, possibly reducing total revenue. This knowledge is essential for making informed decisions about pricing, production, and policy interventions.
 Created using AI


