Table of contents
- 1. Introduction to Macroeconomics2h 3m
- 2. Introductory Economic Models1h 7m
- 3. Supply and Demand3h 23m
- Introduction to Supply and Demand4m
- The Basics of Demand6m
- Individual Demand and Market Demand3m
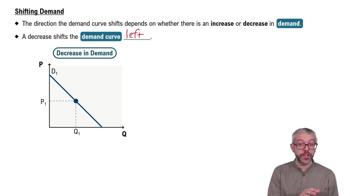
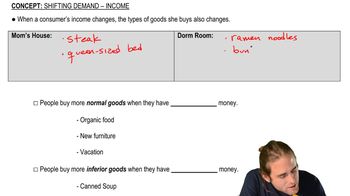
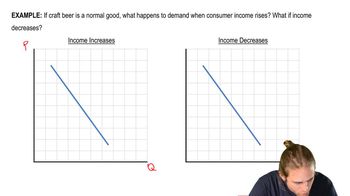
- Shifting Demand38m
- The Basics of Supply2m
- Individual Supply and Market Supply6m
- Shifting Supply28m
- Overview of Supply and Demand Shifts8m
- Supply and Demand Together: Equilibrium, Shortage, and Surplus8m
- Supply and Demand Together: One-sided Shifts20m
- Supply and Demand Together: Both Shift34m
- Supply and Demand: Quantitative Analysis40m
- 4. Elasticity2h 25m
- Percentage Change and Price Elasticity of Demand18m
- Elasticity and the Midpoint Method20m
- Price Elasticity of Demand on a Graph11m
- Determinants of Price Elasticity of Demand6m
- Total Revenue Test13m
- Total Revenue Along a Linear Demand Curve14m
- Income Elasticity of Demand23m
- Cross-Price Elasticity of Demand11m
- Price Elasticity of Supply12m
- Price Elasticity of Supply on a Graph3m
- Elasticity Summary9m
- 5. Consumer and Producer Surplus; Price Ceilings and Price Floors3h 19m
- WIllingness to Pay and Consumer Surplus22m
- Willingness to Sell and Producer Surplus16m
- Economic Surplus and Efficiency18m
- Quantitative Analysis of Consumer and Producer Surplus at Equilibrium28m
- Price Ceilings, Price Floors, and Black Markets38m
- Quantitative Analysis of Price Ceilings and Floors: Finding Points20m
- Quantitative Analysis of Price Ceilings and Floors: Finding Areas54m
- 6. Introduction to Taxes1h 29m
- 7. Externalities54m
- 8. The Types of Goods1h 8m
- 9. International Trade1h 16m
- 10. Introducing Economic Concepts49m
- Introducing Concepts - Business Cycle7m
- Introducing Concepts - Nominal GDP and Real GDP12m
- Introducing Concepts - Unemployment and Inflation3m
- Introducing Concepts - Economic Growth6m
- Introducing Concepts - Savings and Investment5m
- Introducing Concepts - Trade Deficit and Surplus6m
- Introducing Concepts - Monetary Policy and Fiscal Policy7m
- 11. Gross Domestic Product (GDP) and Consumer Price Index (CPI)1h 37m
- Calculating GDP11m
- Detailed Explanation of GDP Components9m
- Value Added Method for Measuring GDP1m
- Nominal GDP and Real GDP22m
- Shortcomings of GDP8m
- Calculating GDP Using the Income Approach10m
- Other Measures of Total Production and Total Income5m
- Consumer Price Index (CPI)13m
- Using CPI to Adjust for Inflation7m
- Problems with the Consumer Price Index (CPI)6m
- 12. Unemployment and Inflation1h 15m
- Labor Force and Unemployment9m
- Types of Unemployment12m
- Labor Unions and Collective Bargaining6m
- Unemployment: Minimum Wage Laws and Efficiency Wages7m
- Nominal Interest, Real Interest, and the Fisher Equation10m
- Nominal Income and Real Income12m
- Who is Affected by Inflation?5m
- Demand-Pull and Cost-Push Inflation6m
- Costs of Inflation: Shoe-leather Costs and Menu Costs4m
- 13. Productivity and Economic Growth1h 17m
- 14. The Financial System1h 37m
- 15. Income and Consumption52m
- 16. Deriving the Aggregate Expenditures Model1h 14m
- 17. Aggregate Demand and Aggregate Supply Analysis1h 18m
- Aggregate Demand12m
- Deriving Aggregate Demand from the Aggregate Expenditure Model12m
- Shifting Aggregate Demand9m
- Long Run Aggregate Supply9m
- Short Run Aggregate Supply7m
- Shifting Short Run Aggregate Supply8m
- AD-AS Model: Equilibrium in the Short Run and Long Run5m
- AD-AS Model: Shifts in Aggregate Demand14m
- 18. The Monetary System1h 1m
- The Functions of Money; The Kinds of Money8m
- Defining the Money Supply: M1 and M24m
- Required Reserves and the Deposit Multiplier8m
- Introduction to the Federal Reserve8m
- The Federal Reserve and the Money Supply11m
- History of the US Banking System9m
- The Financial Crisis of 2007-2009 (The Great Recession)10m
- 19. Monetary Policy1h 32m
- 20. Fiscal Policy52m
- 21. Revisiting Inflation, Unemployment, and Policy46m
- 22. Balance of Payments30m
- 23. Exchange Rates1h 16m
- Exchange Rates: Introduction14m
- Exchange Rates: Nominal and Real13m
- Exchange Rates: Equilibrium6m
- Exchange Rates: Shifts in Supply and Demand11m
- Exchange Rates and Net Exports6m
- Exchange Rates: Fixed, Flexible, and Managed Float5m
- Exchange Rates: Purchasing Power Parity7m
- The Gold Standard4m
- The Bretton Woods System6m
- 24. Macroeconomic Schools of Thought40m
- 25. Dynamic AD/AS Model35m
- 26. Special Topics11m
3. Supply and Demand
Shifting Demand
Struggling with Macroeconomics?
Join thousands of students who trust us to help them ace their exams!Watch the first video
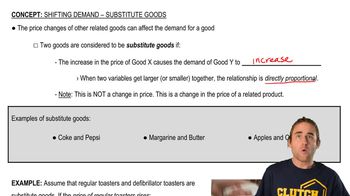
Substitute Goods
Brian Krogol
Video duration:
4mPlay a video:
Related Videos
Related Practice

