4. Genetic Mapping and Linkage
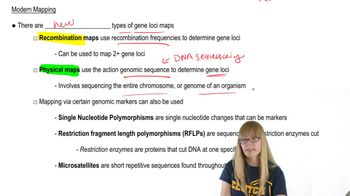
Mapping Genes
Problem 14a
Textbook Question
In Drosophila, a cross was made between females—all expressing the three X-linked recessive traits scute bristles (sc), sable body (s), and vermilion eyes (v)—and wild-type males. In the F₁, all females were wild type, while all males expressed all three mutant traits. The cross was carried to the F₂ generation, and 1000 offspring were counted, with the results shown in the following table. Phenotype Offspring sc s v 314 + + + 280 + s v 150 sc + + 156 sc + v 46 + s + 30 sc s + 10 + + v 14 No determination of sex was made in the data. Determine the sequence of the three genes and the map distances between them.
 Verified step by step guidance
1
Identify the parental phenotypes and genotypes: The parental generation consists of females with scute bristles (sc), sable body (s), and vermilion eyes (v) crossed with wild-type males. The F1 generation shows all females as wild type and all males expressing the mutant traits, indicating that the females are heterozygous for all three traits.
Analyze the F2 offspring: The F2 generation consists of 1000 offspring with various combinations of the three traits. The phenotypes and their frequencies are given in the table.
Determine the gene order: To find the gene order, identify the two most frequent phenotypes (sc s v and + + +) as the parental types. The least frequent phenotypes (sc s + and + + v) are the double crossovers, which help determine the gene order. Compare these with the parental types to deduce the middle gene.
Calculate the recombination frequencies: Use the number of offspring for each recombinant phenotype to calculate the recombination frequency between each pair of genes. Recombination frequency is calculated as (number of recombinant offspring / total number of offspring) * 100.
Construct the genetic map: Using the recombination frequencies, construct a genetic map showing the distances between the genes. The distances are proportional to the recombination frequencies, with 1% recombination equivalent to 1 map unit.
Recommended similar problem, with video answer:
Verified SolutionThis video solution was recommended by our tutors as helpful for the problem above
Video duration:
2mWas this helpful?
Key Concepts
Here are the essential concepts you must grasp in order to answer the question correctly.
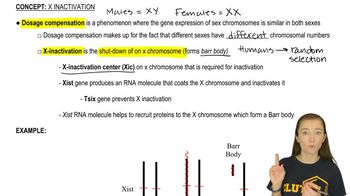
X-linked Inheritance
X-linked inheritance refers to the pattern of inheritance for genes located on the X chromosome. In Drosophila, males have one X chromosome and one Y chromosome, while females have two X chromosomes. This means that recessive traits linked to the X chromosome will manifest in males if they inherit the recessive allele, while females may be carriers if they have one normal allele. Understanding this concept is crucial for interpreting the inheritance patterns observed in the offspring.
Recommended video:
Guided course
 09:30
09:30X-Inactivation
Gene Mapping and Recombination Frequency
Gene mapping involves determining the relative positions of genes on a chromosome and the distances between them, often expressed in map units or centimorgans (cM). The recombination frequency, calculated from the offspring phenotypes, indicates how often crossing over occurs between genes during meiosis. A lower recombination frequency suggests that genes are closer together on the chromosome, while a higher frequency indicates they are further apart. This concept is essential for determining the order of the three X-linked traits in the question.
Recommended video:
Guided course
 09:09
09:09Mapping Genes
Phenotypic Ratios and Chi-Square Analysis
Phenotypic ratios represent the relative frequencies of different phenotypes observed in the offspring of a genetic cross. Analyzing these ratios helps in understanding the inheritance patterns and verifying the expected outcomes based on Mendelian genetics. Chi-square analysis can be used to compare the observed offspring ratios with the expected ratios to assess the validity of the genetic model. This statistical method is important for confirming the gene order and distances derived from the observed data.
Recommended video:
Guided course
 02:48
02:48Chi Square Analysis

Related Videos
Related Practice