3. Extensions to Mendelian Inheritance
Chi Square Analysis
Problem 28b
Textbook Question
To assess Mendel's law of segregation using tomatoes, a true-breeding tall variety (SS) is crossed with a true-breeding short variety (ss). The heterozygous F₁ tall plants (Ss) were crossed to produce two sets of F₂ data, as follows. Set I Set II _ 30 tall 300 tall 5 short 50 short Using the X² test, analyze the results for both datasets. Calculate X² values and estimate the p values in both cases.
 Verified step by step guidance
1
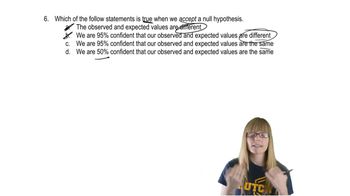
<Step 1: Define the Hypothesis> - Start by defining the null hypothesis (H₀) for the chi-square test. In this case, the hypothesis is that the observed ratios of tall to short plants in the F₂ generation follow the expected Mendelian ratio of 3:1.
<Step 2: Calculate Expected Values> - For each set of data, calculate the expected number of tall and short plants based on the 3:1 ratio. For Set I, with a total of 35 plants, the expected numbers are 26.25 tall and 8.75 short. For Set II, with a total of 350 plants, the expected numbers are 262.5 tall and 87.5 short.
<Step 3: Apply the Chi-Square Formula> - Use the chi-square formula: \( \chi^2 = \sum \frac{(O_i - E_i)^2}{E_i} \), where \( O_i \) is the observed frequency and \( E_i \) is the expected frequency. Calculate \( \chi^2 \) for both Set I and Set II using their respective observed and expected values.
<Step 4: Determine Degrees of Freedom> - The degrees of freedom for a chi-square test is calculated as the number of categories minus one. In this case, there are two categories (tall and short), so the degrees of freedom is 1.
<Step 5: Estimate the p-value> - Using the calculated \( \chi^2 \) values and the degrees of freedom, refer to a chi-square distribution table to estimate the p-value for each dataset. This will help determine if the observed deviations from the expected 3:1 ratio are statistically significant.>
Recommended similar problem, with video answer:
Verified SolutionThis video solution was recommended by our tutors as helpful for the problem above
Video duration:
3mWas this helpful?
Key Concepts
Here are the essential concepts you must grasp in order to answer the question correctly.
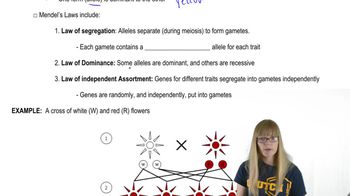
Mendel's Law of Segregation
Mendel's Law of Segregation states that during the formation of gametes, the two alleles for a trait separate, so that each gamete carries only one allele for each gene. This principle explains how offspring inherit one allele from each parent, leading to the observed ratios in phenotypes. In the context of the tomato cross, this law helps predict the expected ratios of tall and short plants in the F₂ generation.
Recommended video:
Guided course
 05:48
05:48Mendel's Laws
Chi-Square Test (X² Test)
The Chi-Square Test is a statistical method used to determine if there is a significant difference between observed and expected frequencies in categorical data. In genetics, it helps assess whether the observed ratios of phenotypes align with the expected ratios based on Mendelian inheritance. By calculating the X² value, researchers can evaluate the fit of their data to the expected genetic model.
Recommended video:
Guided course
 18:27
18:27Chi Square Analysis
P-Value
The p-value is a statistical measure that helps determine the significance of results obtained from a hypothesis test. It indicates the probability of observing the data, or something more extreme, if the null hypothesis is true. In the context of the Chi-Square Test, a low p-value (typically less than 0.05) suggests that the observed data significantly deviates from the expected ratios, leading to the rejection of the null hypothesis.
Recommended video:
Guided course
 03:08
03:08Drosophila P Element
 2:48m
2:48mWatch next
Master Chi Square Analysis with a bite sized video explanation from Kylia Goodner
Start learningRelated Videos
Related Practice