3. Extensions to Mendelian Inheritance
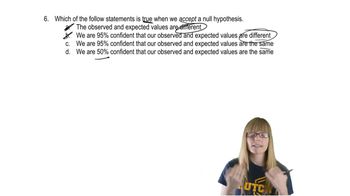
Chi Square Analysis
Problem 20a
Textbook Question
Experimental Insight 2.1 describes data, collected by a genetics class like yours, on the numbers of kernels of different colors in bicolor corn. To test the hypothesis that the presence of kernels of different colors in each ear is the result of the segregation of two alleles of a single gene, the class counted 12,356 kernels and found that 9304 were yellow and 3052 were white. Use chi-square analysis to evaluate the fit between the segregation hypothesis and the class results.
 Verified step by step guidance
1
Step 1: Formulate the null hypothesis (H0) that the observed ratio of yellow to white kernels fits the expected Mendelian ratio for a single gene with two alleles. Typically, this would be a 3:1 ratio for dominant to recessive phenotypes.
Step 2: Calculate the expected number of yellow and white kernels based on the total number of kernels (12,356) and the expected 3:1 ratio. This involves multiplying the total number of kernels by 3/4 for yellow and 1/4 for white.
Step 3: Use the chi-square formula: \( \chi^2 = \sum \frac{(O_i - E_i)^2}{E_i} \), where \( O_i \) is the observed frequency and \( E_i \) is the expected frequency for each phenotype. Calculate the chi-square value using the observed (9304 yellow, 3052 white) and expected values.
Step 4: Determine the degrees of freedom for the chi-square test. For a single gene with two phenotypes, the degrees of freedom is \( n - 1 \), where \( n \) is the number of phenotypic categories (2 in this case).
Step 5: Compare the calculated chi-square value to the critical value from the chi-square distribution table at the desired significance level (commonly 0.05) and the appropriate degrees of freedom to decide whether to accept or reject the null hypothesis.
Recommended similar problem, with video answer:
Verified SolutionThis video solution was recommended by our tutors as helpful for the problem above
Video duration:
7mWas this helpful?
Key Concepts
Here are the essential concepts you must grasp in order to answer the question correctly.
Alleles and Segregation
Alleles are different versions of a gene that can exist at a specific locus on a chromosome. In the context of bicolor corn, the segregation of two alleles refers to the process during meiosis where these alleles are separated into different gametes. This concept is fundamental to understanding how traits are inherited and how variations in traits, such as kernel color, arise in offspring.
Recommended video:
Guided course

 03:03
03:03New Alleles and Migration
Chi-Square Analysis
Chi-square analysis is a statistical method used to determine if there is a significant difference between observed and expected frequencies in categorical data. In this case, it will help assess whether the observed distribution of yellow and white kernels fits the expected ratio based on the segregation hypothesis. A significant result would suggest that the observed data does not conform to the expected genetic model.
Recommended video:
Guided course
 02:48
02:48Chi Square Analysis
Hypothesis Testing
Hypothesis testing is a statistical procedure that allows researchers to make inferences about populations based on sample data. In this scenario, the null hypothesis would state that the observed kernel colors follow the expected segregation ratio, while the alternative hypothesis would suggest a deviation from this expectation. Understanding this process is crucial for interpreting the results of the chi-square analysis and drawing conclusions about the genetic basis of kernel color.
Recommended video:
Guided course
 03:13
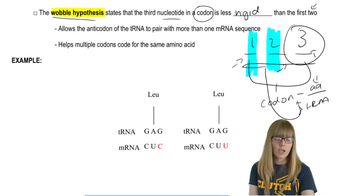
03:13Translation:Wobble Hypothesis
 2:48m
2:48mWatch next
Master Chi Square Analysis with a bite sized video explanation from Kylia Goodner
Start learningRelated Videos
Related Practice