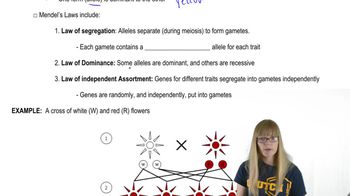
2. Mendel's Laws of Inheritance
Mendel's Experiments and Laws
Problem 13
Textbook Question
Figure 2.12 shows the results of Mendel's test-cross analysis of independent assortment. In this experiment, he first crossed pure-breeding round, yellow plants to pure-breeding wrinkled, green plants. The round yellow are crossed to pure-breeding wrinkled, green plants. Use chi-square analysis to show that Mendel's results do not differ significantly from those expected.
 Verified step by step guidance
1
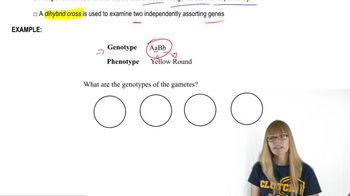
Identify the expected phenotypic ratio for a dihybrid cross involving two traits that assort independently. For Mendel's round (R) and yellow (Y) versus wrinkled (r) and green (y) traits, the expected ratio is 9:3:3:1.
Determine the observed numbers of each phenotype from Mendel's experiment. These are typically given in the problem or figure referenced.
Calculate the expected number of each phenotype based on the total number of observed offspring and the expected 9:3:3:1 ratio. For example, if there are 160 total offspring, the expected numbers would be 90 round yellow, 30 round green, 30 wrinkled yellow, and 10 wrinkled green.
Use the chi-square formula: \( \chi^2 = \sum \frac{(O_i - E_i)^2}{E_i} \), where \( O_i \) is the observed frequency and \( E_i \) is the expected frequency for each phenotype.
Compare the calculated chi-square value to the critical value from the chi-square distribution table with the appropriate degrees of freedom (number of phenotypic categories minus 1) to determine if the difference is statistically significant.
Verified video answer for a similar problem:This video solution was recommended by our tutors as helpful for the problem above
Video duration:
1mWas this helpful?
Key Concepts
Here are the essential concepts you must grasp in order to answer the question correctly.
Mendelian Genetics
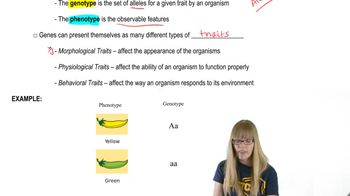
Mendelian genetics is the study of how traits are inherited through generations, based on the principles established by Gregor Mendel. His experiments with pea plants led to the formulation of key concepts such as dominant and recessive traits, as well as the laws of segregation and independent assortment, which explain how alleles segregate during gamete formation.
Recommended video:
Guided course
 03:45
03:45Descriptive Genetics
Chi-Square Analysis
Chi-square analysis is a statistical method used to determine whether there is a significant difference between observed and expected frequencies in categorical data. In the context of Mendel's experiments, it helps assess whether the ratio of phenotypes observed in offspring aligns with the ratios predicted by Mendelian inheritance, allowing researchers to evaluate the validity of genetic hypotheses.
Recommended video:
Guided course
 02:48
02:48Chi Square Analysis
Independent Assortment
The principle of independent assortment states that alleles for different traits segregate independently of one another during gamete formation. This means that the inheritance of one trait does not influence the inheritance of another, leading to a variety of genetic combinations in the offspring, which Mendel demonstrated through his dihybrid crosses.
Recommended video:
Guided course
 04:58
04:58Gamete Genetics and Independent Assortment
 8:06m
8:06mWatch next
Master Mendel's Experiments with a bite sized video explanation from Kylia Goodner
Start learningRelated Videos
Related Practice