2. Mendel's Laws of Inheritance
Monohybrid Cross
Problem 18
Textbook Question
The following are F₂ results of two of Mendel's monohybrid crosses. (a) full pods 882 constricted pods 299 (b) violet flowers 705 white flowers 224 For each cross, state a null hypothesis to be tested using x² analysis. Calculate the x² value and determine the p value for both. Interpret the p values. Can the deviation in each case be attributed to chance or not? Which of the two crosses shows a greater amount of deviation?
 Verified step by step guidance
1
<insert step 1: Define the null hypothesis for each monohybrid cross. For cross (a), the null hypothesis is that the observed ratio of full pods to constricted pods follows the expected Mendelian ratio of 3:1. For cross (b), the null hypothesis is that the observed ratio of violet flowers to white flowers follows the expected Mendelian ratio of 3:1.>
<insert step 2: Calculate the expected numbers for each phenotype based on the total number of observations and the expected 3:1 ratio. For cross (a), calculate the expected number of full pods and constricted pods. For cross (b), calculate the expected number of violet flowers and white flowers.>
<insert step 3: Use the chi-square (x²) formula to calculate the x² value for each cross. The formula is x² = Σ((observed - expected)² / expected), where you sum over all categories.>
<insert step 4: Determine the degrees of freedom for each cross. Since there are two categories (e.g., full and constricted pods), the degrees of freedom is 1 (number of categories - 1).>
<insert step 5: Use the chi-square distribution table to find the p-value corresponding to the calculated x² value and 1 degree of freedom for each cross. Interpret the p-value to determine if the deviation from the expected ratio can be attributed to chance. Compare the x² values to determine which cross shows a greater deviation.>
Recommended similar problem, with video answer:
Verified SolutionThis video solution was recommended by our tutors as helpful for the problem above
Video duration:
2mWas this helpful?
Key Concepts
Here are the essential concepts you must grasp in order to answer the question correctly.
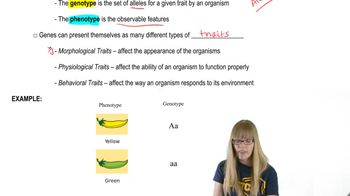
Mendelian Genetics
Mendelian genetics is the study of how traits are inherited through generations, based on the principles established by Gregor Mendel. His experiments with pea plants led to the formulation of laws of inheritance, including the law of segregation and the law of independent assortment. Understanding these principles is crucial for analyzing genetic crosses and predicting offspring ratios.
Recommended video:
Guided course
 03:45
03:45Descriptive Genetics
Chi-Square (x²) Test
The Chi-Square test is a statistical method used to determine if there is a significant difference between observed and expected frequencies in categorical data. In genetics, it helps assess whether the observed ratios of phenotypes in offspring align with Mendelian predictions. A calculated x² value is compared against a critical value from the Chi-Square distribution to determine significance.
Recommended video:
Guided course
 18:27
18:27Chi Square Analysis
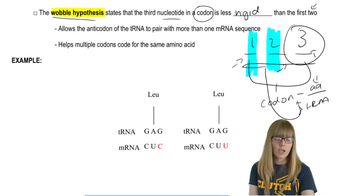
Null Hypothesis
The null hypothesis is a statement that assumes no effect or no difference, serving as a starting point for statistical testing. In the context of Mendelian crosses, it typically posits that the observed phenotypic ratios match the expected ratios based on Mendelian inheritance. Testing this hypothesis using the Chi-Square test helps determine if deviations from expected ratios are due to chance or indicate a significant difference.
Recommended video:
Guided course
 03:13
03:13Translation:Wobble Hypothesis
 1:20m
1:20mWatch next
Master Monohybrid Cross with a bite sized video explanation from Kylia Goodner
Start learningRelated Videos
Related Practice