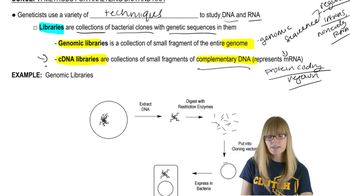
18. Molecular Genetic Tools
Methods for Analyzing DNA
Problem 31a
Textbook Question
Textbook QuestionA total of 20 men and 20 women volunteer to participate in a statistics project. The height and weight of each subject are given in the table. Draw one histogram for height of the subjects and a separate histogram for weight. Use different colors for men and women so that you can visually compare the distributions by sex and plot weights in 10-lb intervals (i.e., 90–99 lb, 100–109 lb, 110–119 lb, etc.).
 Verified Solution
This video solution was recommended by our tutors as helpful for the problem above
Video duration:
1m176
views
Was this helpful?
Related Videos
Related Practice
 07:40
07:40