Heating and Cooling Curves definitions Flashcards
 Back
BackHeating and Cooling Curves definitions
1/15
 03:52
03:52

Terms in this set (15)
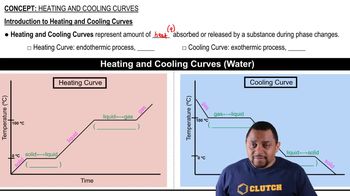
- Heating CurveGraph showing heat absorption by a substance during phase changes, indicating endothermic processes.
- Cooling CurveGraph depicting heat release by a substance during phase changes, indicating exothermic processes.
- Endothermic ProcessA process where a substance absorbs heat, resulting in a positive heat variable (Q).
- Exothermic ProcessA process where a substance releases heat, resulting in a negative heat variable (Q).
- Phase ChangeTransition of a substance between solid, liquid, and gas phases, marked by constant temperature.
- MeltingTransition from solid to liquid, occurring at a constant temperature, also known as fusion.
- VaporizationTransition from liquid to gas, occurring at a constant temperature, requiring energy absorption.
- CondensationTransition from gas to liquid, occurring at a constant temperature, involving energy release.
- FreezingTransition from liquid to solid, occurring at a constant temperature, involving energy release.
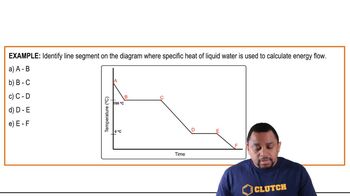
- Specific Heat CapacityAmount of heat required to change the temperature of a unit mass of a substance by one degree.
- Kinetic EnergyEnergy of motion, increasing with temperature during temperature changes.
- Potential EnergyEnergy stored during phase changes, maintaining constant temperature and kinetic energy.
- EnthalpyMeasure of heat content used in phase change calculations, represented by ΔH.
- PlateauFlat section on a heating or cooling curve indicating a phase change with constant temperature.
- Delta T (ΔT)Change in temperature, calculated as final temperature minus initial temperature.