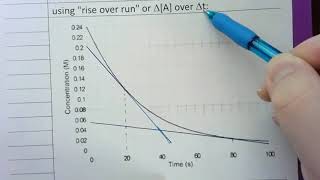
Multiple ChoiceConsider the decomposition of dinitrogen pentoxide:2 N2O5 (g) → 4 NO2 (g) + O2 (g)What is the instantaneous rate of this reaction at 20 seconds?1238views14rank1comments
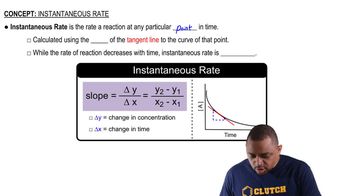
Textbook Question(c) As a reaction proceeds, does the instantaneous reaction rate increase or decrease?777views
Textbook QuestionThe isomerization of methyl isonitrile 1CH3NC2 to acetonitrile 1CH3CN2 was studied in the gas phase at 215 C, and the following data were obtained: Time (s) 3CH3nC4 1M2 0 0.0165 2000 0.0110 5000 0.00591 8000 0.00314 12,000 0.00137 15,000 0.00074 (d) Graph 3CH3NC4 versus time and determine the instantaneous rates in M>s at t = 5000 s and t = 8000 s.749views
Textbook QuestionThe rate of disappearance of HCl was measured for the following reaction: CH3OH1aq2 + HCl1aq2¡CH3Cl1aq2 + H2O1l2 The following data were collected: Time (min) 3HCl 4 1M2 0.0 1.85 54.0 1.58 107.0 1.36 215.0 1.02 430.0 0.580 (d) Graph [HCl] versus time and determine the instantaneous rates in M>min and M>s at t = 75.0 min and t = 250 min.866views
Textbook QuestionConsider the reaction: H2( g) + Br2( g) ¡ 2 HBr( g) The graph shows the concentration of Br2 as a function of time. a. Use the graph to calculate each quantity: (iii) the instantaneous rate of formation of HBr at 50 s915views1rank
Textbook QuestionConsider the reaction: H2( g) + Br2( g) ¡ 2 HBr( g) The graph shows the concentration of Br2 as a function of time. b. Make a rough sketch of a curve representing the concentration of HBr as a function of time. Assume that the initial concentration of HBr is zero750views
Textbook QuestionConsider the reaction: 2 H2O2(aq) ¡ 2 H2O(l ) + O2( g) The graph shows the concentration of H2O2 as a function of time. Use the graph to calculate each quantity: c. the instantaneous rate of formation of O2 at 50 s1891views
Textbook QuestionUse the information in Table 14.1 and Figure 14.1 to estimate the instantaneous rate of appearance of NO2 at t = 350 s by calculating the average rate of appearance of NO2 over the following time intervals centered on t = 350 s. (a) 0 to 700 s (b) 100 to 600 s (c) 200 to 500 s (d) 300 to 400 s Which is the best estimate, and why?681views
Textbook QuestionFrom the plot of concentration–time data in Figure 14.1, estimate: (b) the initial rate of decomposition of N2O5.301views
Textbook QuestionFrom the plot of concentration–time data in Figure 14.1, estimate: (a) the instantaneous rate of decomposition of N2O5 at t = 200 s.391views
Textbook QuestionFrom a plot of the concentration–time data in Worked Example 14.9, estimate: (b) the initial rate of decomposition of NO2.311views
Textbook QuestionFrom a plot of the concentration–time data in Worked Example 14.9, estimate: (a) the instantaneous rate of decomposition of NO2 at t = 100 s.466views

 01:30
01:30