18. Aqueous Equilibrium - Part 2 of 3
18. Aqueous Equilibrium / Weak Titrate-Strong Titrant Curves / Problem 6
The image below shows the titration of a weak base with a strong acid.
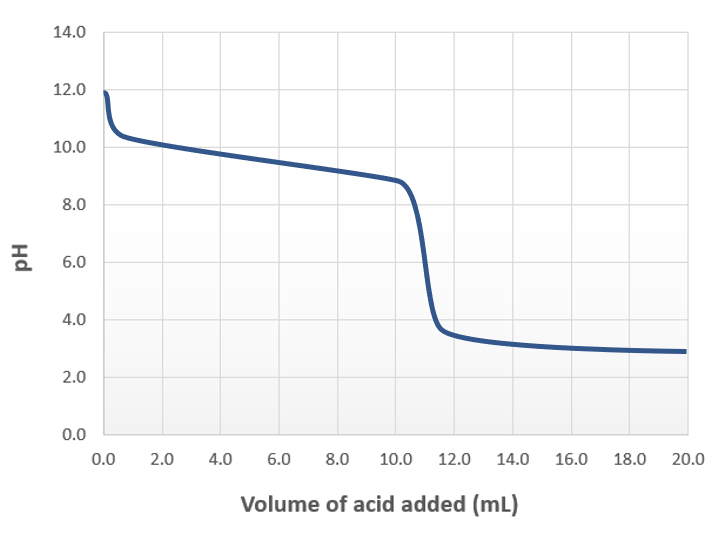
Determine the volume of added acid where the equilibrium concentration of the species in the solution and Ka of the conjugate acid is used to calculate pH.

Learn this concept