How much ice (in grams) would have to melt to lower the temperature of 352 mL of water from 25 °C to 5 °C? (Assume the density of water is 1.0 g/mL.)
Ch.11 - Liquids, Solids & Intermolecular Forces
Chapter 11, Problem 73
Consider the phase diagram shown here. Identify the states present at points a through g.
 Verified step by step guidance
1
Identify the axes of the phase diagram. Typically, the x-axis represents temperature and the y-axis represents pressure.
Locate each point (a through g) on the phase diagram.
Determine the regions separated by the lines on the phase diagram. These regions usually represent different states of matter: solid, liquid, and gas.
For each point (a through g), identify which region it falls into to determine the state of matter present at that point.
If any point lies on a line or at a triple point, note that it represents equilibrium between phases or all three phases coexisting, respectively.

Verified Solution
Video duration:
2mWas this helpful?
Key Concepts
Here are the essential concepts you must grasp in order to answer the question correctly.
Phase Diagram
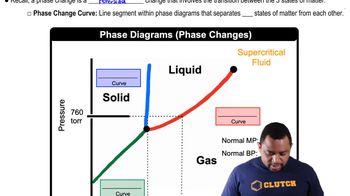
A phase diagram is a graphical representation that shows the states of a substance (solid, liquid, gas) at various temperatures and pressures. It illustrates the conditions under which distinct phases occur and coexist, helping to visualize transitions such as melting, boiling, and sublimation.
Recommended video:
Guided course

Phase Changes in Diagrams
Triple Point
The triple point of a substance is the specific condition at which all three phases (solid, liquid, and gas) coexist in equilibrium. This unique point is critical for understanding phase transitions and is used as a reference for defining temperature and pressure scales.
Recommended video:
Guided course

Boiling Point Elevation
Critical Point
The critical point marks the end of the phase boundary between the liquid and gas phases. Beyond this point, the substance cannot exist as a liquid regardless of pressure, leading to a supercritical fluid state where distinct liquid and gas phases do not exist.
Recommended video:
Guided course

Boiling Point Elevation
Related Practice
Textbook Question
4830
views
Open Question
How much heat (in kJ) is required to warm 10.0 g of ice, initially at -10.0 °C, to steam at 110.0 °C? The heat capacity of ice is 2.09 J/g°C, and that of steam is 2.01 J/g°C.
Open Question
How much heat (in kJ) is evolved in converting 1.00 mol of steam at 145 °C to ice at -50 °C? The heat capacity of steam is 2.01 J/g°C, and that of ice is 2.09 J/g°C.
Open Question
Consider the phase diagram for iodine shown here. a. What is the normal boiling point for iodine? b. What is the melting point for iodine at 1 atm? c. What state is present at room temperature and normal atmospheric pressure? d. What state is present at 186 °C and 1.0 atm?
Textbook Question
Nitrogen has a normal boiling point of 77.3 K and a melting point (at 1 atm) of 63.1 K. Its critical temperature is 126.2 K and its critical pressure is 2.55×10⁴ torr. It has a triple point at 63.1 K and 94.0 torr. Sketch the phase diagram for nitrogen. Does nitrogen have a stable liquid state at 1 atm?
2550
views
Textbook Question
Argon has a normal boiling point of 87.2 K and a melting point (at 1 atm) of 84.1 K. Its critical temperature is 150.8 K and its critical pressure is 48.3 atm. It has a triple point at 83.7 K and 0.68 atm. Sketch the phase diagram for argon. Which has the greater density, solid argon or liquid argon?
2352
views
