Ch.17 - Applications of Aqueous Equilibria
Chapter 17, Problem 41b

The following plot shows two pH titration curves, each representing the titration of 50.0 mL of 0.100 M acid with 0.100 M NaOH:
Graph showing pH titration curves for weak acids with NaOH, indicating equivalence points.
. (b) What is the approximate pH at the equivalence point for each of the acids?

Verified step by step guidance
1
Identify the equivalence point on each titration curve. This is the point where the curve shows a steep rise in pH, indicating that the amount of NaOH added is stoichiometrically equivalent to the amount of acid present.
For each curve, locate the volume of NaOH added at the equivalence point. This is typically where the curve is the steepest.
Determine the pH at the equivalence point for each curve by reading the pH value corresponding to the volume of NaOH added at the equivalence point.
Compare the pH values at the equivalence points for the two acids. Note that the pH at the equivalence point for a weak acid titrated with a strong base is typically greater than 7.
Record the approximate pH values at the equivalence points for each of the acids based on the graph.

Verified Solution

Video duration:
4m
This video solution was recommended by our tutors as helpful for the problem above.
Was this helpful?

Key Concepts

Here are the essential concepts you must grasp in order to answer the question correctly.

Titration

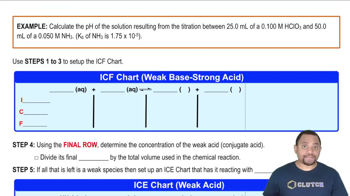
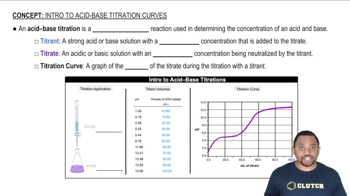
Titration is a quantitative analytical technique used to determine the concentration of an unknown solution by reacting it with a solution of known concentration. In this case, the titration involves a weak acid being neutralized by a strong base (NaOH), which results in a change in pH that can be plotted to visualize the reaction's progress.
Recommended video:
Guided course
03:04
Acid-Base Titration

Equivalence Point

The equivalence point in a titration is the stage at which the amount of titrant added is stoichiometrically equivalent to the amount of substance present in the sample solution. At this point, the reaction between the acid and base is complete, and the pH of the solution changes dramatically, often indicated by a steep slope in the titration curve.
Recommended video:
Guided course
01:07
At the Equivalence Point

pH of the Equivalence Point

The pH at the equivalence point varies depending on the strength of the acid and base involved in the titration. For a weak acid titrated with a strong base, the pH at the equivalence point will be greater than 7 due to the formation of a weak conjugate base, which can hydrolyze in water, resulting in a basic solution.
Recommended video:
Guided course
07:28
pH at the Equivalence Point Example
Related Practice
Textbook Question

The following pictures represent solutions that contain one or more of the compounds H2A, NaHA, and Na2A, where H2A is a weak diprotic acid. (Na+ ions and solvent water molecules have been omitted for clarity.)

(a) Which of the solutions are buffer solutions?

392
views
Textbook Question

The following pictures represent solutions that contain one or more of the compounds H2A, NaHA, and Na2A, where H2A is a weak diprotic acid. (Na+ ions and solvent water molecules have been omitted for clarity.)

(b) Which solution has the greatest buffer capacity?

815
views
Textbook Question

The following plot shows two pH titration curves, each representing the titration of 50.0 mL of 0.100 M acid with 0.100 M NaOH:

. (a) Which of the two curves represents the titration of a strong acid? Which represents a weak acid?

800
views
Textbook Question

The following plot shows two pH titration curves, each representing the titration of 50.0 mL of 0.100 M acid with 0.100 M NaOH:

. (c) What is the approximate pKa of the weak acid?

370
views
1
rank
Textbook Question

The following pictures represent solutions at various stages in the titration of a weak base B with aqueous HCl. (Cl- ions and solvent water molecules have been omitted for clarity.)

. (a) To which of the following stages do solutions 1–4 correspond? (i) The initial solution before addition of any HCl (ii) Halfway to the equivalence point (iii) At the equivalence point (iv) Beyond the equivalence point

809
views
Textbook Question

The following pictures represent solutions at various stages in the titration of a weak base B with aqueous HCl. (Cl- ions and solvent water molecules have been omitted for clarity.)

. (b) Is the pH at the equivalence point more or less than 7?

595
views