Vertical Analysis - Video Tutorials & Practice Problems
On a tight schedule?
Get a 10 bullets summary of the topic
1
concept
Vertical Analysis
Video duration:
8m
Play a video:
Video transcript
So it's important to be able to analyze financial statements as well as create them in this class. While another way we can analyze them is through a vertical analysis, let's check it out. So, you may have previously learned about a horizontal analysis where we do a percentage change from one year to the next. If not, you'll learn about it in a different video here. We're going to learn about the vertical analysis. Vertical analysis is still dealing with percentage changes, but we're not dealing with a year over year changes anymore. We're going to be dealing with a percentage of the base amount on the financial statement. So we're going to do this for an income statement and the balance sheet.
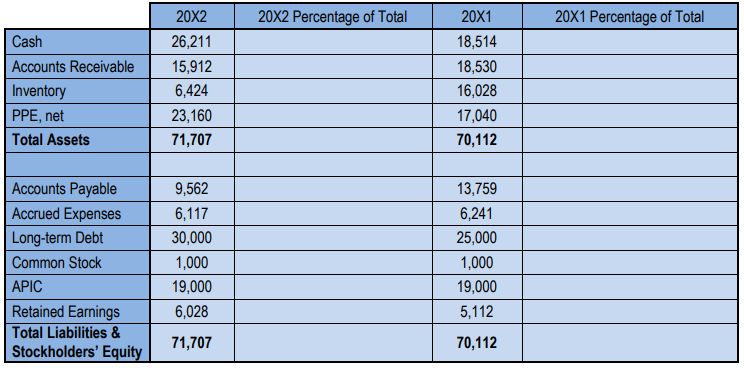
 So let's see what the base amount is going to be for each of those statements on the income statement. Our base amount is going to be our net sales, Okay. Our net sales or just our sales revenue, right? Or our sales revenue. If we don't have a net sales amount, we're gonna use that top line sales revenue, whatever the top line is on your on your income statement, that's what we're using as our base. Okay. And then we're gonna have on the balance sheet, our base is gonna be our total assets and we're also gonna use so for the assets part, we're gonna use total assets and for the liabilities and equity, we're gonna use total liabilities and equity. But remember, these numbers are the same, aren't they? Right? Total assets, equal total liabilities and equity. So they're gonna be the same number. Okay. So either way we're gonna have that number uh as our balance sheet? Base All right, so what do I mean when I say base, that's what we're gonna use as the denominator in our percentage formula. Okay, So remember that when we find the percentage of the base, what we're gonna do is we're gonna take the line item amount, say um selling expense like we have down here, and we're gonna divide it by the base amount. So if that was on the income statement, it would be the selling expense, whatever that amount is for the year, divided by the net sales. Okay, because we're dealing with the income statement and remember that we're getting a percentage. So we are going to multiply this by 100 To move the decimal place two places and get a percentage. Okay, so let me go ahead and show you how we do a vertical analysis here on an income statement and then you guys can get some practice on a balance sheet. Okay, so let's go ahead and do it for two years here. We've got 2018 And we've got our net sales. So remember that net sales, this is our base amount. Okay, this is the base amount. So this is always gonna be the denominator and every single one of our calculations, the base amount is net sales for that year. Okay, so 2018, the base amount is always going to be 65-455. And when we do 2017 it'll always be 58081. Okay, so let's go ahead and do a couple of them and then I'm gonna speed it up. I've done a lot of these calculations ahead of time, just gonna be a lot of number crunching. All right, that's why we became accountants is because we love using our calculator, hit all those buttons. Alright, let's go ahead and do it. So net sales, this one's always gonna be 100% right? It's gonna be 100% of itself. Right? So this this calculation we would do 65455. The line item amount divided by the base amount which is net sales. So that's gonna be obviously one. Right? We multiply it by 100 to get the percentage and that one is 100%. So net sales is 100% of itself, wow, that's very revealing information. But let's go on down and we'll start getting some better information. How about cost of goods sold? So remember the numerator is going to be the line item. So 54912 is our numerator and we divided by net sales. Right? Net sales is always gonna be the denominator. 65455. Cool. Alright, so let's go ahead and you just do that division And we'll get it as a percentage and we see that it's 83.9%. I'm gonna be rounding just to one decimal here. Cool. So we can do our vertical analysis to sub totals as well. Remember gross profit is a sub total, it's not its own uh expands or revenue. It's a sub total. It's just net sales minus cost of goods sold. Well, we can find out what gross profit is out of net sales. So we would do the same thing 10,543 5 10,043 divided by net sales, the same number 65455. And we get it as a percentage. We multiplied by 100 to get a percentage and we'll get 16.1%. Okay, so this is pretty good information Already, we can see that out of net sales 83%. So for every dollar of net sales, almost 84% of it is going to pay for that sales, right? So we get a dollar of sales, well, 84 cents of that dollar is going to pay for the cost of goods sold, and we're left with 16 cents at this point. Right? And then we still got to pay for other stuff, right? We're gonna have other expenses and we're gonna end up with our net income. So this lets us know how much of a percent of net sales. So we get a dollar of sales, how much of that is going to different places. Cool, Let's keep going here with our operating expenses. So I'm gonna write this one out. But after this, I think you should get the point of how we do this calculation. And I'm gonna start putting in our percentages. So 2411, right? Our line item is our numerator divided by 65455. Still using that same uh net sales amount as our numerator. And let's go ahead, do that division and we get 3.7%. Cool, we keep going 9 82 divided by 65455, And we get 1.5%. So we know for every dollar of sales what 1.5% of that is going to selling expense. Maybe some commission we pay to our salesperson, they get 1.5% off of every sale depreciation expense. 1400 divided by 65455, same thing, 2.1% here. And we can do it with total operating expenses. How much our our total operating expenses as a percentage of our sales, and we get 7.3% here. Right, let's keep going down another sub total income from operations. Right, this is where we take our gross profit minus the operating expenses. This is all of our core business. How much are we making? Well, 57 50 out of that? 65455. That comes out to be 8.8%. Right, That means for every dollar of sales. Well, we're keeping 8.8 cents from operations and then we've got a couple more things we gotta pay for and then we're left with our net income. So let's do those next we've got interest expense 4 80 divided by 65455 and we're gonna get 0.7%. Cool, how about the next one other expenses. Look how small this is $70. That doesn't seem like a very big part of net sales. We do our our calculation 70 divided by 654550.1%. Vertical analysis is pretty easy, right? We're just doing this simple division. All you got to remember is what that base amount is gonna be. So here we go income. Before taxes We get 5200 divided by our net sales and we get 7.9%. And then income tax expense. Well that's 2080 divided by the net sales and we get 3.2%. And then finally our net income 3120 divided by 65455. And we get 4.8%. So this tells us our bottom line, it tells us that for every dollar we sell, well we get to keep 4.8 cents as income. Okay? We pay for everything we got to pay for and we get to keep 4.8 cents. Cool. Alright. So let's go ahead and pause here and then we're gonna do 2017. Alright, let's do that now.
2
example
Vertical Analysis
Video duration:
4m
Play a video:
Video transcript
Alright, so let's run through 2017 and do our income statement vertical analysis. So notice this time we're still dealing with the same base our bases still net sales, but we've got to use the 2017 number. Right? Now we're gonna use 58 oh 81 as our denominator. Okay. Before we're using 65455 as a denominator because it was 2018. Well, for 2017 we use their net sales number and it's gonna be the same thing. Right? We're going to see that for Sorry for net sales. Well, it's always gonna be 100% right? It's always 100% of itself because it is our base. Cool. So let's start going down. I'll write a couple of these out and then we'll see that it's very much the same as what we did 45377. Right, This is our cost of goods sold, divided by 58 oh 81 And that gives us 78.1 right, 78.1%. Uh once we multiply by 100 there we do the same thing with gross profit. 12 704 divided by 58 oh 81 right, Same base amount all the way down. And it's gonna be 21.9%. And this should make sense. Right? If we have 100% in net sales and 78.1 went to pay for the cost of goods sold, well, whatever leftover is gross profit. So the 100% minus the 78.1 should be 21.9 and it is all right, So that should make sense, right? We kept the 21.9 and this is where it starts to be beneficial to. Not only can we make that analysis going down, but now we can compare year by year two, we can kind of do some sort of horizontal analysis with our vertical analysis where we see that we had 16.1% as our gross profit in 2018, 21.9% in 2017. So that's gone down a bit. That could be important information to an investor to a bank that's loaning us money, right? They would like to know this information. Even the company itself gets good information out of this. So let's keep going down here. The next one we'll rent, expense. It didn't change year over year 2411, but It's coming out of less net sales, right? So, we can imagine it's gonna be a bigger percentage because we've got a smaller denominator. So that's gonna be a bigger percentage of it. So, right now it's 4.2%. Once we do that and multiplied by 100 we get 4.2%. Cool. So, you can see the math is very much the same as what we did in 2018. I'm gonna start going down a little faster here. Let me get out the way. So we have the 871 divided by our same base and we're gonna get 1.5%. Cool. And the depreciation expense 902, this one is 1.6% right? This is 902 divided by our net sales of 58081. And let's just keep going down. Total operating expenses 4184 divided by 58 oh 81 gets 7.2% And the next 185 20 in our numerator and we get 14.7%. How about interest expense? Well 400 divided by the net sales and we get 0.7% other expenses. 1 20 divided by 580810.2% Left with our income before taxes at this point and we just do our 8000 divided by the net sales and it tells us that income before taxes is 13.8% of net sales are income tax of 3200, that's gonna be 3200, divided by the net sales is 5.5%. And finally our net income. So we're left with 4800 at the end of the day off of net sales of 58 081 and we get 8.3%. Okay, so this is a big part of the vertical analysis, is that bottom line, right? We can see that for every dollar of sales in 2017 we get to keep 8.3 cents after all of our expenses. Where in 2018 we only got to keep $4.8 for each dollar. Right? So that's a big red flag. Maybe to investors. What's going on with the expenses? Maybe they're getting a little out of control, um, so they can do a little more analysis with that information. Cool. So you can see a vertical analysis is pretty straightforward. Now, why don't you guys try it with the balance sheet? Remember, we're gonna have a different base amount on the balance sheet. So check what we called above and go ahead and try it before watching the next video, and we'll go through it together. All right, let's do it, right.
3
Problem
Problem
Complete a vertical analysis of the following balance sheet:
Video duration:
6m
Play a video:
Was this helpful?
4
Problem
Problem
Complete a vertical analysis of the following balance sheet: