Ch. 4 - Exponential and Logarithmic Functions
Chapter 5, Problem 1

In Exercises 1–4, the graph of an exponential function is given. Select the function for each graph from the following options: f(x) = 4^x, g(x) = 4^-x, h(x) = -4^(-x), r(x) = -4^(-x)+3 1. Graph of an exponential function with point (0,2) marked.

Verified step by step guidance
1
Observe the graph and note that it passes through the point (0, 2).
Identify the general shape of the graph. It is decreasing and approaches a horizontal asymptote.
Compare the graph with the given function options: f(x) = 4^x, g(x) = 4^-x, h(x) = -4^(-x), r(x) = -4^(-x)+3.
Notice that the graph has a horizontal asymptote at y = 2, which suggests a vertical shift.
Select the function r(x) = -4^(-x) + 3, as it matches the observed behavior and vertical shift of the graph.

Verified video answer for a similar problem:

This video solution was recommended by our tutors as helpful for the problem above.
Video duration:
4m
Was this helpful?

Key Concepts

Here are the essential concepts you must grasp in order to answer the question correctly.

Exponential Functions

Exponential functions are mathematical expressions in the form f(x) = a^x, where 'a' is a positive constant. These functions exhibit rapid growth or decay, depending on whether 'a' is greater than or less than 1. 
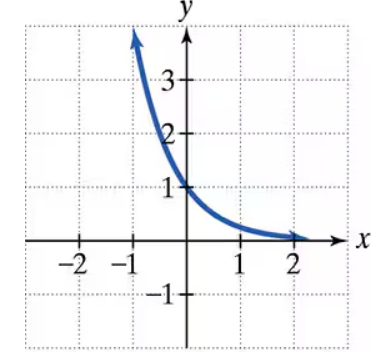
The graph of an exponential function is characterized by a continuous curve that approaches the x-axis but never touches it, known as a horizontal asymptote.
Recommended video:
6:13
Exponential Functions

Graph Characteristics

The graph of an exponential function has distinct characteristics, including a y-intercept at (0, a) and a horizontal asymptote along the x-axis. If the base 'a' is greater than 1, the function increases as x increases; if 'a' is between 0 and 1, the function decreases. The steepness of the curve is influenced by the value of 'a', with larger bases resulting in steeper growth.
Recommended video:
Guided course
02:16
Graphs and Coordinates - Example

Transformations of Functions

Transformations of functions involve shifting, reflecting, or stretching the graph of a function. For example, a negative exponent indicates a reflection across the y-axis, while adding a constant shifts the graph vertically. Understanding these transformations is crucial for identifying the correct function that matches a given graph, as they alter the basic shape and position of the exponential function.
Recommended video:
4:22
Domain & Range of Transformed Functions