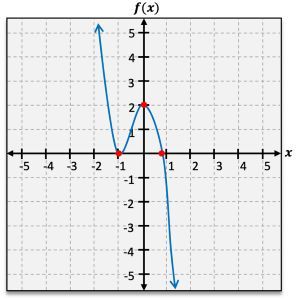
Hey, everyone. We now know how to find a bunch of different individual elements of the graph of a polynomial function, like the end behavior, whether a graph is rising or falling on either end, the x-intercept, where a graph is either crossing or touching our x-axis, our y-intercept, where our graph crosses our y-axis, and how many turning points our graph might have where it changes direction from increasing to decreasing or vice versa. Now, even with all of this great information, we still are missing something. We're not quite sure what's happening in between all of these points. So, how do we fill in that missing information in order to give us the complete graph of a polynomial function? Well, here, I'm going to show you how we're going to do that by simply finding and plotting points in these areas that we are not quite sure what's happening yet. So let's go ahead and get started. Because we do have all of these points that we know, we're simply going to break our graph down into intervals of unknown behavior, so these places that I don't know what's happening, and simply find and plot a point in each of these intervals. So, let's take a look at our graph down here. Now, I'm going to go in this graph from left to right, looking at each of my known points and going in between them to create intervals. So, looking at my graph starting on this left side going into the right, I'm not really sure what's happening here until I get to this known point of negative 2. So all the way from negative infinity until I get to this point negative 2 I'm not quite sure what's happening. I don't know how steep this end behavior is going to be even if I already know it's going down. So that represents my first interval of unknown information from negative infinity until negative 2. Let's keep going.
So from negative 2, where is my next known point? Well, my next known point is going to be my y-intercept at x equals 0. So from negative 2 until I reach that point at 0, which will actually always be a known piece of information, I don't know what's happening. I don't know if this is going to be a lower turning point or it's going to go much steeper. So that represents my next interval. Now, from 0, where's my next known point? Well, it's right here at x equals 3. So from 0 to 3, again, I'm not quite sure what's happening here, so this represents my next interval of unknown behavior. And then finally, from 3 and beyond, again, I'm not quite sure how steep or not so steep this end behavior is going to be, so from 3 to infinity represents my last interval. These four intervals represent all of the places that I don't know the behavior of my graph. I'm not quite sure how steep it's going to be, whether it's going really high or really low. So in each of these intervals, we want to find one x value for which we can calculate f(x) in order to give us an ordered pair that we can plot on our graph.
So, inside of my first interval, negative infinity to negative 2, I want to choose a point that I can calculate f(x) for and then plot on my graph. There is some strategy to picking this point because I don't want to pick something like negative 100 because I'm not going to be able to plot that on my graph and it's not really going to help me out here. So I want to choose something that is actually going to help me on my graph. So because I have this point negative 2, I might want to know what's happening at negative 3. So I'm going to choose x equals negative 3 and then I would simply calculate f of negative 3, giving me an ordered pair to plot on my graph, giving me some more information in that interval. So moving on to our next interval from negative 2 to 0, in this interval, it might be a little more obvious, some number that we should choose for x. I'm just going to go directly in between at x equals negative 1, and then I would want to compute f of negative 1 in order to give me an ordered pair to plot on my graph. Then into my next interval from 0 to 3 remember, you can choose anything in this interval as long as you're going to be able to graph it. So I'm just going to choose at x equals 2. And then I would simply calculate f of 2 and plot that point on my graph. Then my final interval from 3 to infinity, remember we don't want to choose anything crazy that's not actually going to help us here so I'm simply going to choose x equals 4 and then I would want to calculate f of 4 giving me my final point of unknown behavior.
Okay, now that we have all of these points and we've plotted them on our graph, this is where we would actually want to connect all of these points to give us a clear picture of what's happening here. So with all of that information, I now am left with the complete graph of a polynomial function. If you want to plot some more points here, that's totally fine. You can always choose some more values for x to find your f(x) in order to give you an even more complete picture of the graph of your polynomial function. But now that we know everything that we need to graph any polynomial function let's go ahead and get to graphing.


