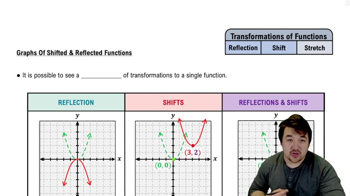
Multiple ChoiceWritten below (green dotted curve) is a graph of the function f(x)=x−2f\left(x\right)=\sqrt{x-2}f(x)=x−2. If g(x) (blue solid curve) is a reflection of f(x) about the y-axis what is the equation for g(x)?188views6rank
Multiple ChoiceThe green dotted line in the graph below represents the function f(x)f\left(x\right)f(x). The blue solid line represents the function g(x)g\left(x\right)g(x), which is the function f(x)f\left(x\right)f(x) after it has gone through a shift transformation. Find the equation for g(x)g\left(x\right)g(x).252views3rank
Multiple ChoiceThe green dotted curve below is a graph of the function f(x)f\left(x\right)f(x). Find the domain and range of g(x)g\left(x\right)g(x) (the blue solid curve), which is a transformation of f(x)f\left(x\right)f(x).334views2rank
Textbook QuestionIn Exercises 1-16, use the graph of y = f(x) to graph each function g. g(x) = f(x)+1186views
Textbook QuestionIn Exercises 1-16, use the graph of y = f(x) to graph each function g. g(x) = f(x+1)400views
Textbook QuestionIn Exercises 1-16, use the graph of y = f(x) to graph each function g. g(x) = f(-x)174views
Textbook QuestionIn Exercises 1-16, use the graph of y = f(x) to graph each function g. g(x) = -f(x) +3178views
Textbook QuestionIn Exercises 1-16, use the graph of y = f(x) to graph each function g. g(x) = f(-x)+3263views
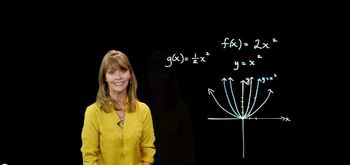
Textbook QuestionIn Exercises 1-16, use the graph of y = f(x) to graph each function g. g(x) = 2f(x)222views
Textbook QuestionIn Exercises 1-16, use the graph of y = f(x) to graph each function g. g(x) = f(x/2)172views
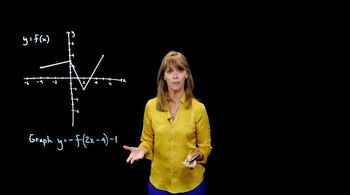
Textbook QuestionIn Exercises 1-16, use the graph of y = f(x) to graph each function g. g(x) = -f(2x) - 1200views
Textbook QuestionIn Exercises 17-32, use the graph of y = f(x) to graph each function g. g(x) = f(x) - 1176views
Textbook QuestionIn Exercises 17-32, use the graph of y = f(x) to graph each function g. g(x) = f(x-1)186views
Textbook QuestionIn Exercises 17-32, use the graph of y = f(x) to graph each function g. g(x) = f(x-1)+2238views
Textbook QuestionIn Exercises 17-32, use the graph of y = f(x) to graph each function g. g(x) = f(x + 1) − 2155views
Textbook QuestionIn Exercises 17-32, use the graph of y = f(x) to graph each function g. g(x) = f(-x)179views
Textbook QuestionIn Exercises 17-32, use the graph of y = f(x) to graph each function g. g(x) = f(-x)+1228views
Textbook QuestionIn Exercises 17-32, use the graph of y = f(x) to graph each function g. g(x) = -f(x)+1167views
Textbook QuestionIn Exercises 17-32, use the graph of y = f(x) to graph each function g. g(x) = ½ f(x)164views
Textbook QuestionIn Exercises 33-44, use the graph of y = f(x) to graph each function g. g(x) = f(x)+2212views
Textbook QuestionIn Exercises 33-44, use the graph of y = f(x) to graph each function g. g(x) = f(x+2)164views
Textbook QuestionPlot each point, and then plot the points that are symmetric to the given point with respect to the (a) x-axis, (b) y-axis, and (c) origin. (5, -3)201views
Textbook QuestionIn Exercises 33-44, use the graph of y = f(x) to graph each function g. g(x) = -(1/2)f(x+2)163views
Textbook QuestionPlot each point, and then plot the points that are symmetric to the given point with respect to the (a) x-axis, (b) y-axis, and (c) origin. (-4, -2)153views
Textbook QuestionIn Exercises 33-44, use the graph of y = f(x) to graph each function g. g(x) = -½ ƒ ( x + 2) —2180views
Textbook QuestionIn Exercises 33-44, use the graph of y = f(x) to graph each function g. g(x) = (1/2)f(2x)188views
Textbook QuestionWithout graphing, determine whether each equation has a graph that is symmetric with respect to the x-axis, the y-axis, the origin, or none of these. See Examples 3 and 4. y=x^2+5759views
Textbook QuestionIn Exercises 45-52, use the graph of y = f(x) to graph each function g. g(x) = -f(x-1) + 1206views
Textbook QuestionWithout graphing, determine whether each equation has a graph that is symmetric with respect to the x-axis, the y-axis, the origin, or none of these. See Examples 3 and 4. x^2+y^2=12280views
Textbook QuestionIn Exercises 45-52, use the graph of y = f(x) to graph each function g. g(x) = -f(x + 1) − 1180views
Textbook QuestionIn Exercises 45-52, use the graph of y = f(x) to graph each function g. g(x)=2f(x-1)228views
Textbook QuestionIn Exercises 53-66, begin by graphing the standard quadratic function, f(x) = x². Then use transformations of this graph to graph the given function. g(x) = x² - 2225views
Textbook QuestionIn Exercises 53-66, begin by graphing the standard quadratic function, f(x) = x². Then use transformations of this graph to graph the given function. g(x) = (x − 2)²187views
Textbook QuestionIn Exercises 55–59, use the graph of to graph each function g. g(x) = f(x + 2) + 3173views
Textbook QuestionIn Exercises 55–59, use the graph of to graph each function g. g(x) = -f(2x)194views
Textbook QuestionIn Exercises 60–63, begin by graphing the standard quadratic function, f(x) = x^2. Then use transformations of this graph to graph the given function. g(x) = x^2 + 2178views
Textbook QuestionIn Exercises 60–63, begin by graphing the standard quadratic function, f(x) = x^2. Then use transformations of this graph to graph the given function. r(x) = -(x + 1)^2190views
Textbook QuestionIn Exercises 53-66, begin by graphing the standard quadratic function, f(x) = x². Then use transformations of this graph to graph the given function. g(x) = (1/2)(x − 1)²192views
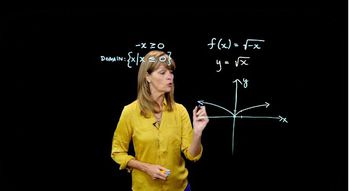
Textbook QuestionIn Exercises 64–66, begin by graphing the square root function, f(x) = √x. Then use transformations of this graph to graph the given function. g(x) = √(x + 3)162views
Textbook QuestionIn Exercises 53-66, begin by graphing the standard quadratic function, f(x) = x². Then use transformations of this graph to graph the given function. h(x) = (1/2) (x − 1)² – 1320views
Textbook QuestionIn Exercises 64–66, begin by graphing the square root function, f(x) = √x. Then use transformations of this graph to graph the given function. r(x) = 2√(x + 2)521views
Textbook QuestionIn Exercises 53-66, begin by graphing the standard quadratic function, f(x) = x². Then use transformations of this graph to graph the given function. h(x) = -2(x+2)²+1151views
Textbook QuestionGraph each function. See Examples 6–8 and the Summary of Graphing Techniques box following Example 9. ƒ(x)=x^2+2138views
Textbook QuestionIn Exercises 67-80, begin by graphing the square root function, f(x) = √x. Then use transformations of this graph to graph the given function. g(x) = √x + 1172views
Textbook QuestionIn Exercises 67-80, begin by graphing the square root function, f(x) = √x. Then use transformations of this graph to graph the given function. g(x) = √(x+1)172views
Textbook QuestionIn Exercises 67-80, begin by graphing the square root function, f(x) = √x. Then use transformations of this graph to graph the given function. h(x)=-√(x + 1)193views
Textbook QuestionConsider the following nonlinear system. Work Exercises 75 –80 in order. y = | x - 1 | y = x^2 - 4 How is the graph of y = | x - 1 | obtained by transforming the graph of y = | x |?146views
Textbook QuestionGraph each function. See Examples 6–8 and the Summary of Graphing Techniques box following Example 9. h(x)=-(x+1)^3136views
Textbook QuestionIn Exercises 67-80, begin by graphing the square root function, f(x) = √x. Then use transformations of this graph to graph the given function. h(x) = √(x+1)-1171views
Textbook QuestionIn Exercises 67-80, begin by graphing the square root function, f(x) = √x. Then use transformations of this graph to graph the given function. g(x) = 2√(x+1)-1167views
Textbook QuestionGraph each function. See Examples 6–8 and the Summary of Graphing Techniques box following Example 9. ƒ(x)=-3(x-2)^2+1141views
Textbook QuestionIn Exercises 81–94, begin by graphing the absolute value function, f(x) = |x|. Then use transformations of this graph to graph the given function. g(x) = |x|+3183views
Textbook QuestionIn Exercises 81–94, begin by graphing the absolute value function, f(x) = |x|. Then use transformations of this graph to graph the given function. g(x) = |x+3|186views
Textbook QuestionGraph each function. See Examples 6–8 and the Summary of Graphing Techniques box following Example 9. ƒ(x)=2√x+1166views
Textbook QuestionIn Exercises 81–94, begin by graphing the absolute value function, f(x) = |x|. Then use transformations of this graph to graph the given function. h(x) = |x + 3| - 2181views
Textbook QuestionGraph each function. See Examples 6–8 and the Summary of Graphing Techniques box following Example 9. ƒ(x)=3√x-2168views
Textbook QuestionIn Exercises 81–94, begin by graphing the absolute value function, f(x) = |x|. Then use transformations of this graph to graph the given function. h(x) = 2|x+3|181views
Textbook QuestionIn Exercises 81–94, begin by graphing the absolute value function, f(x) = |x|. Then use transformations of this graph to graph the given function. g(x) = -2|x+3|+2146views
Textbook QuestionEach of the following graphs is obtained from the graph of ƒ(x)=|x| or g(x)=√x by applying several of the transformations discussed in this section. Describe the transformations and give an equation for the graph. 151views
Textbook QuestionIn Exercises 95-106, begin by graphing the standard cubic function, f(x) = x³. Then use transformations of this graph to graph the given function. g(x) = x³-3162views
Textbook QuestionDescribe how the graph of each function can be obtained from the graph of ƒ(x) = |x|. g(x) = -|x|522views
Textbook QuestionIn Exercises 95-106, begin by graphing the standard cubic function, f(x) = x³. Then use transformations of this graph to graph the given function. g(x) = (x − 3)^3195views
Textbook QuestionLet ƒ(x) = 3x -4. Find an equation for each reflection of the graph of ƒ(x). across the x-axis230views
Textbook QuestionIn Exercises 95-106, begin by graphing the standard cubic function, f(x) = x³. Then use transformations of this graph to graph the given function. h(x) = -x³170views
Textbook QuestionLet ƒ(x) = 3x -4. Find an equation for each reflection of the graph of ƒ(x). across the y-axis148views
Textbook QuestionEach of the following graphs is obtained from the graph of ƒ(x)=|x| or g(x)=√x by applying several of the transformations discussed in this section. Describe the transformations and give an equation for the graph. 178views
Textbook QuestionThe graph of a function ƒ is shown in the figure. Sketch the graph of each function defined as follows. (a) y = ƒ(x) +3147views
Textbook QuestionThe graph of a function ƒ is shown in the figure. Sketch the graph of each function defined as follows. (b) y = ƒ(x-2)164views
Textbook QuestionThe graph of a function ƒ is shown in the figure. Sketch the graph of each function defined as follows. (c) y = ƒ(x+3) - 2286views
Textbook QuestionIn Exercises 95-106, begin by graphing the standard cubic function, f(x) = x³. Then use transformations of this graph to graph the given function. r(x) = (x − 2)³ +1168views
Textbook QuestionThe graph of a function ƒ is shown in the figure. Sketch the graph of each function defined as follows. (d) y = |ƒ(x)|259views
Textbook QuestionIn Exercises 107-118, begin by graphing the cube root function, f(x) = ∛x. Then use transformations of this graph to graph the given function. g(x) = ∛x+2316views
Textbook QuestionIn Exercises 107-118, begin by graphing the cube root function, f(x) = ∛x. Then use transformations of this graph to graph the given function. g(x) = ∛(x-2)575views
Textbook QuestionIn Exercises 107-118, begin by graphing the cube root function, f(x) = ∛x. Then use transformations of this graph to graph the given function. g(x) = (1/2)∛(x-2)176views
Textbook QuestionIn Exercises 107-118, begin by graphing the cube root function, f(x) = ∛x. Then use transformations of this graph to graph the given function. g(x) = (1/2)∛(x+2) - 2220views
Textbook QuestionIn Exercises 107-118, begin by graphing the cube root function, f(x) = ∛x. Then use transformations of this graph to graph the given function. ∛(-x-2)258views
Textbook QuestionIn Exercises 81–94, begin by graphing the absolute value function, f(x) = |x|. Then use transformations of this graph to graph the given function. g(x) = -|x + 4| +2285views


 5:25
5:25