Table of contents
- 0. Review of Algebra(0)
- 1. Equations & Inequalities(0)
- 2. Graphs of Equations(0)
- 3. Functions(0)
- 4. Polynomial Functions(0)
- 5. Rational Functions(0)
- 6. Exponential & Logarithmic Functions(0)
- 7. Systems of Equations & Matrices(0)
- 8. Conic Sections(0)
- 9. Sequences, Series, & Induction(0)
- 10. Combinatorics & Probability(0)
2. Graphs of Equations
Lines
2. Graphs of Equations
Lines: Study with Video Lessons, Practice Problems & Examples
61PRACTICE PROBLEM
Consider the given graph.
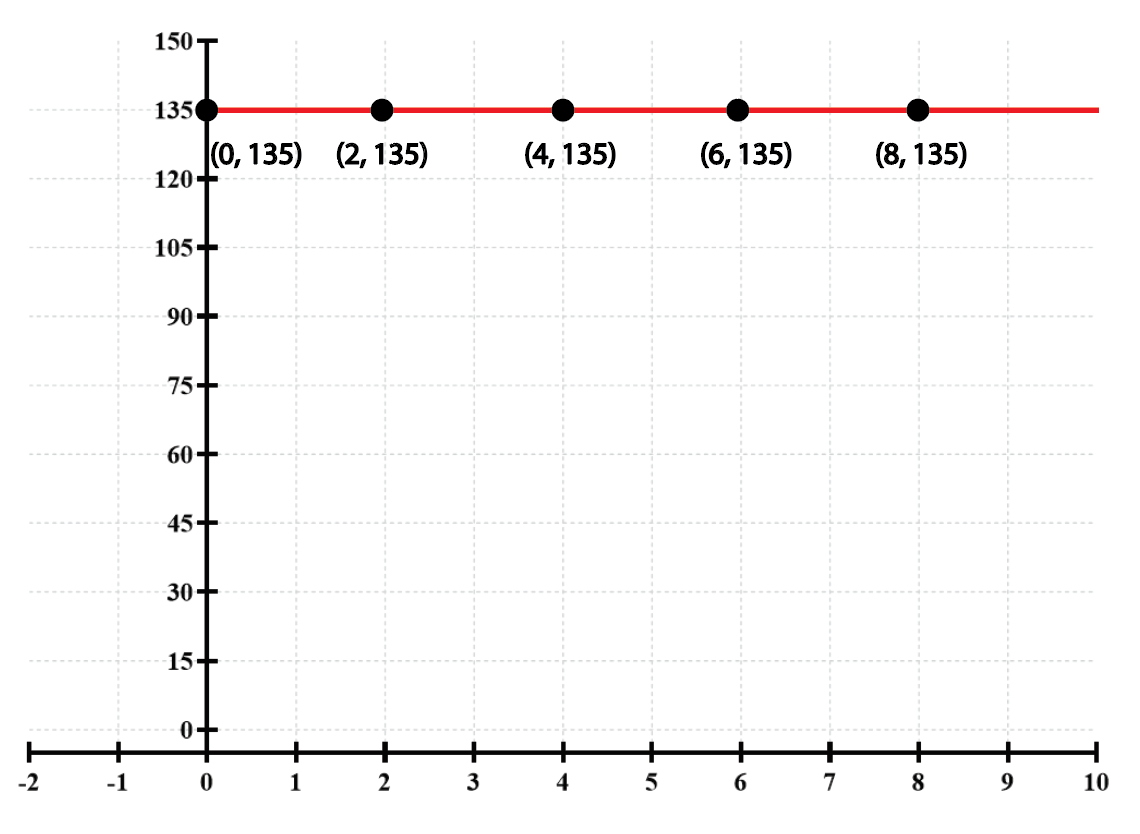
What is the average rate of change illustrated? And what does it mean?
Consider the given graph.
What is the average rate of change illustrated? And what does it mean?