6. Exponential & Logarithmic Functions
Introduction to Logarithms
6. Exponential & Logarithmic Functions
Introduction to Logarithms: Study with Video Lessons, Practice Problems & Examples
51PRACTICE PROBLEM
For the given functions,
f(x) = log x
g(x) = - log(x - 1)
(i) Graph in the same cartesian plane
(ii) Identify all asymptotes
(iii) Identify Domain and Range
a) (i) Graph: 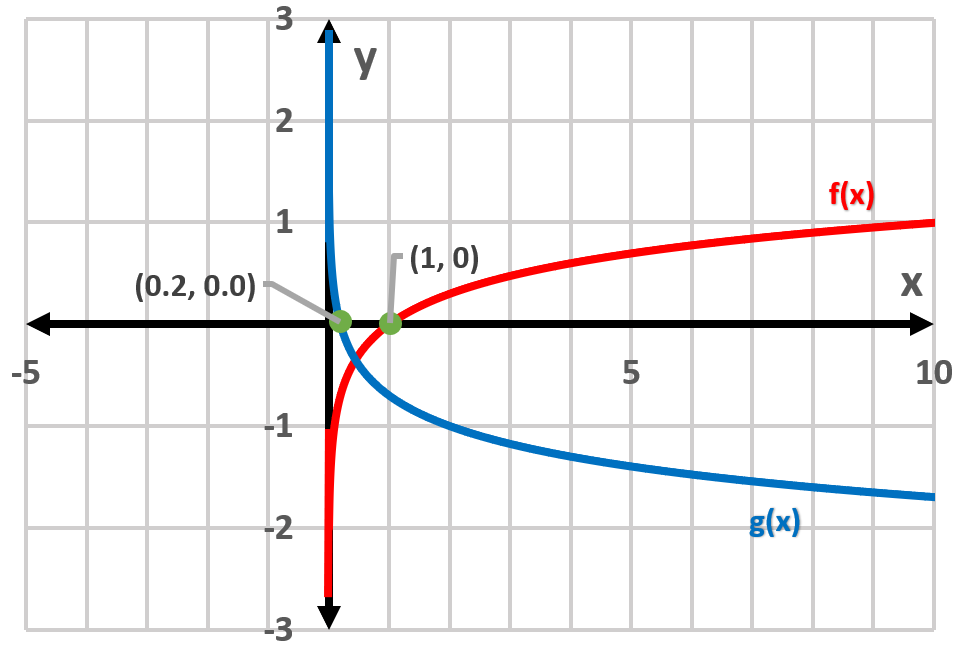
(ii) Asymptotes f(x): x = 0, g(x): x = 0,
(iii) Domain f(x): x > 0; g(x): x > 0; Range f(x): all real values; g(x): all real values
b) (i) Graph: 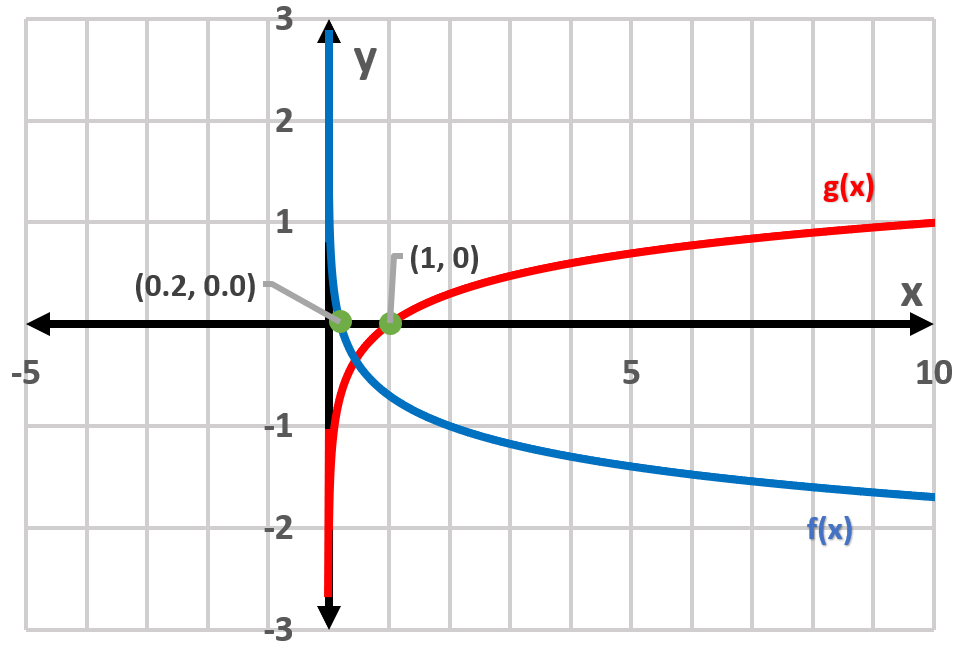
(ii) Asymptotes f(x): x = 0, g(x): x = 0,
(iii) Domain f(x): x < 0; g(x): x < 0; Range f(x): f(x) > 0; g(x): g(x) > 0
c) (i) Graph: 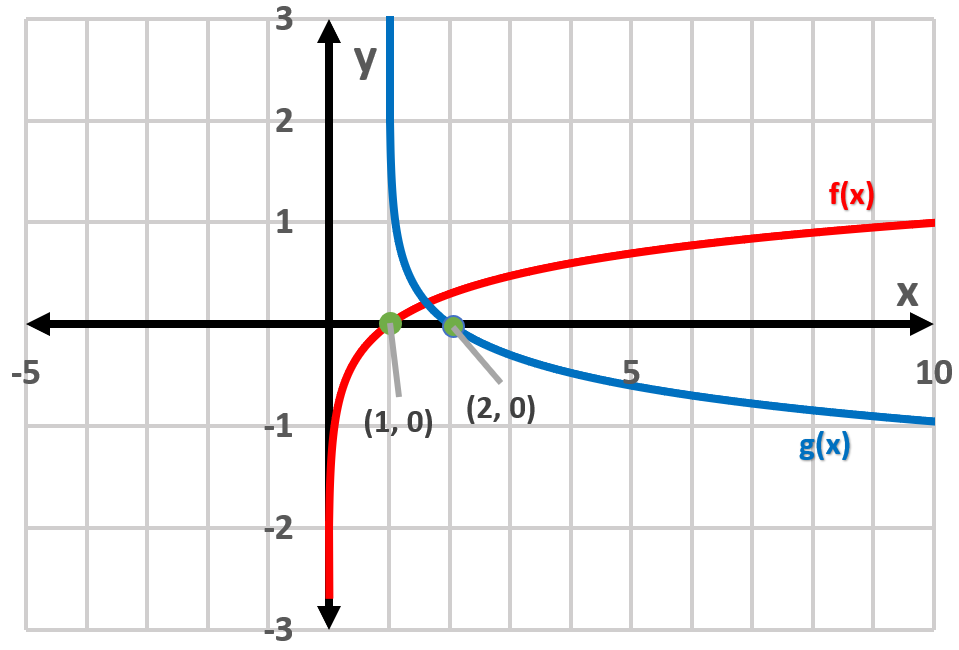
(ii) Asymptotes f(x): x = 0, g(x): x = 1,
(iii) Domain f(x): x > 0; g(x): x > 1; Range f(x): all real values; g(x): all real values
d) (i) Graph: 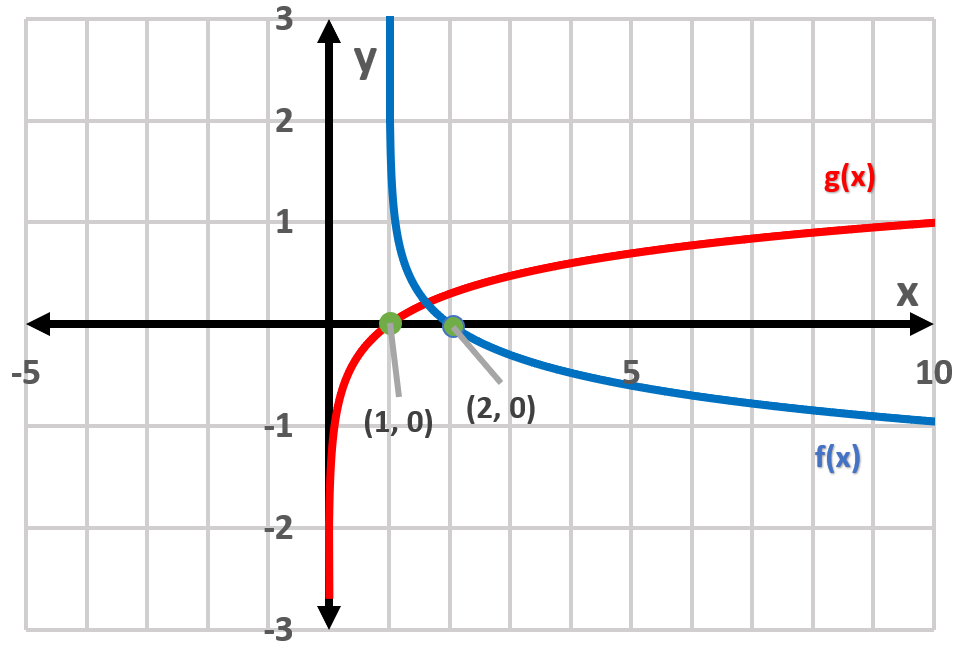
(ii) Asymptotes f(x): x = 1, g(x): x = 0,
(iii) Domain f(x): x > 1; g(x): x > 0; Range f(x): all real values; g(x): all real values
For the given functions,
f(x) = log x
g(x) = - log(x - 1)
(i) Graph in the same cartesian plane
(ii) Identify all asymptotes
(iii) Identify Domain and Range
a) (i) Graph:
(ii) Asymptotes f(x): x = 0, g(x): x = 0,
(iii) Domain f(x): x > 0; g(x): x > 0; Range f(x): all real values; g(x): all real values
b) (i) Graph:
(ii) Asymptotes f(x): x = 0, g(x): x = 0,
(iii) Domain f(x): x < 0; g(x): x < 0; Range f(x): f(x) > 0; g(x): g(x) > 0
c) (i) Graph:
(ii) Asymptotes f(x): x = 0, g(x): x = 1,
(iii) Domain f(x): x > 0; g(x): x > 1; Range f(x): all real values; g(x): all real values
d) (i) Graph:
(ii) Asymptotes f(x): x = 1, g(x): x = 0,
(iii) Domain f(x): x > 1; g(x): x > 0; Range f(x): all real values; g(x): all real values