Graph each function. Give the domain and range. See Example 3. ƒ(x) = 2x+3 +1
Verified step by step guidance
1
Identify the base function and transformations: The base function is an exponential function \(f(x) = 2^x\). The given function is \(f(x) = 2^{(x+3)} + 1\), which involves a horizontal shift and a vertical shift.
Determine the horizontal shift: The expression \(x + 3\) inside the exponent means the graph of \$2^x\( is shifted 3 units to the left. This is because replacing \)x\( with \)x + 3$ moves the graph left by 3.
Determine the vertical shift: The \(+1\) outside the exponential function shifts the entire graph up by 1 unit. This affects the horizontal asymptote and the range.
Find the domain: Since exponential functions are defined for all real numbers, the domain of \(f(x) = 2^{(x+3)} + 1\) is all real numbers, which can be written as \((-\infty, \infty)\).
Find the range: The base function \$2^x\( has a range of \((0, \infty)\). After shifting up by 1, the new range becomes \((1, \infty)\) because the horizontal asymptote moves from \)y=0\( to \)y=1$.
Verified video answer for a similar problem:
This video solution was recommended by our tutors as helpful for the problem above
Video duration:
9m
Play a video:
0 Comments
Key Concepts
Here are the essential concepts you must grasp in order to answer the question correctly.
Exponential Functions
An exponential function has the form f(x) = a^(x), where the variable is in the exponent. In this question, f(x) = 2^(x+3) + 1 is an exponential function with base 2, shifted horizontally and vertically. Understanding how the base and transformations affect the graph is essential.
The domain is the set of all possible input values (x-values), and the range is the set of all possible output values (f(x)-values). For exponential functions like f(x) = 2^(x+3) + 1, the domain is all real numbers, while the range depends on vertical shifts and asymptotes.
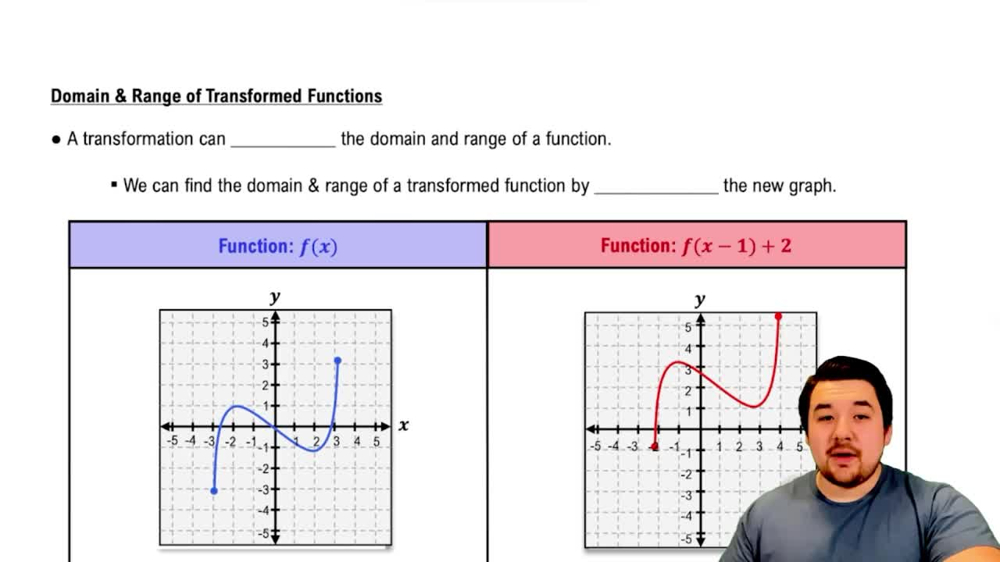
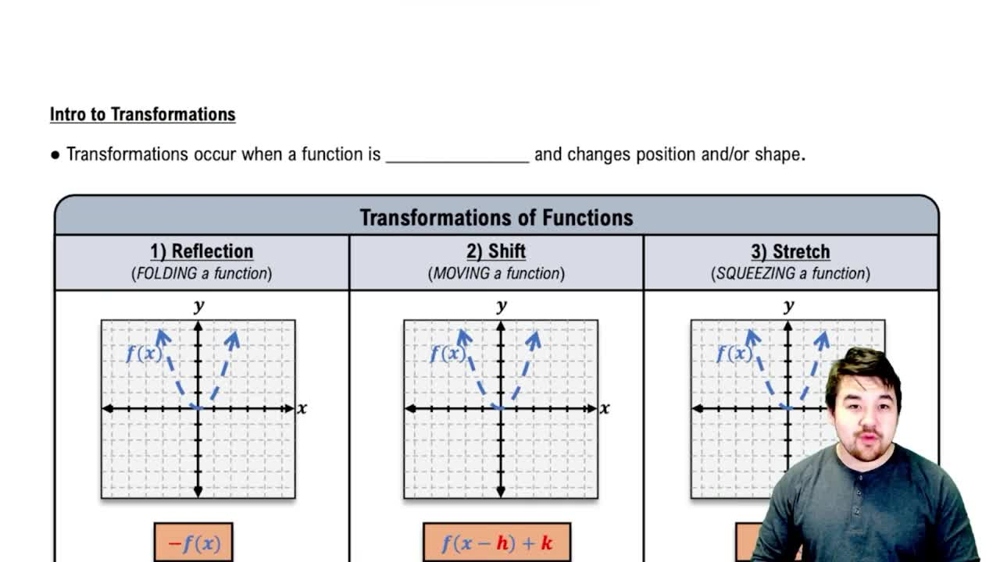
Graph transformations involve shifting, stretching, or reflecting the base graph. In f(x) = 2^(x+3) + 1, the '+3' inside the exponent shifts the graph left by 3 units, and the '+1' outside shifts it up by 1 unit. Recognizing these helps in accurately sketching the graph.

 Verified step by step guidance
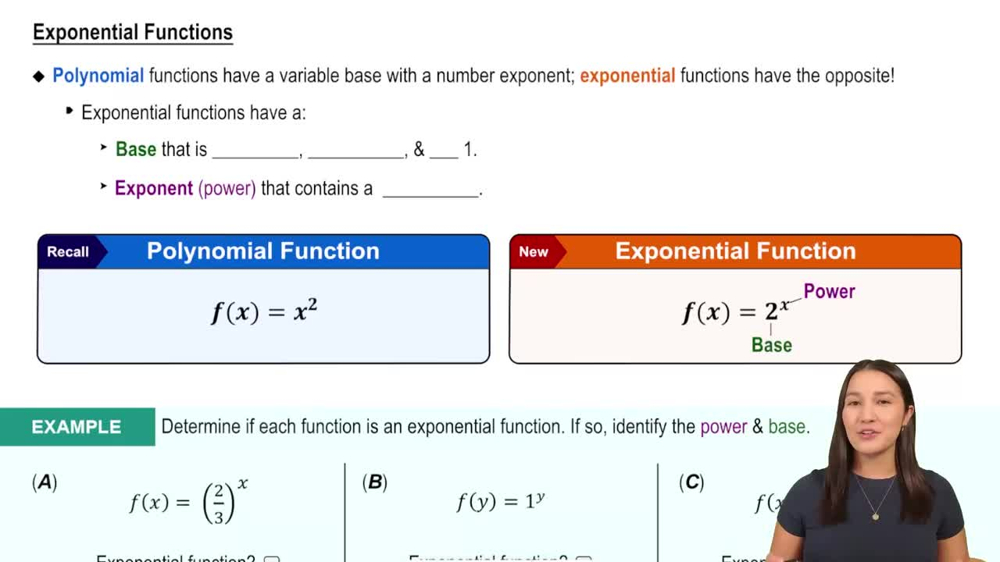
 6:13
6:13