
Textbook Question
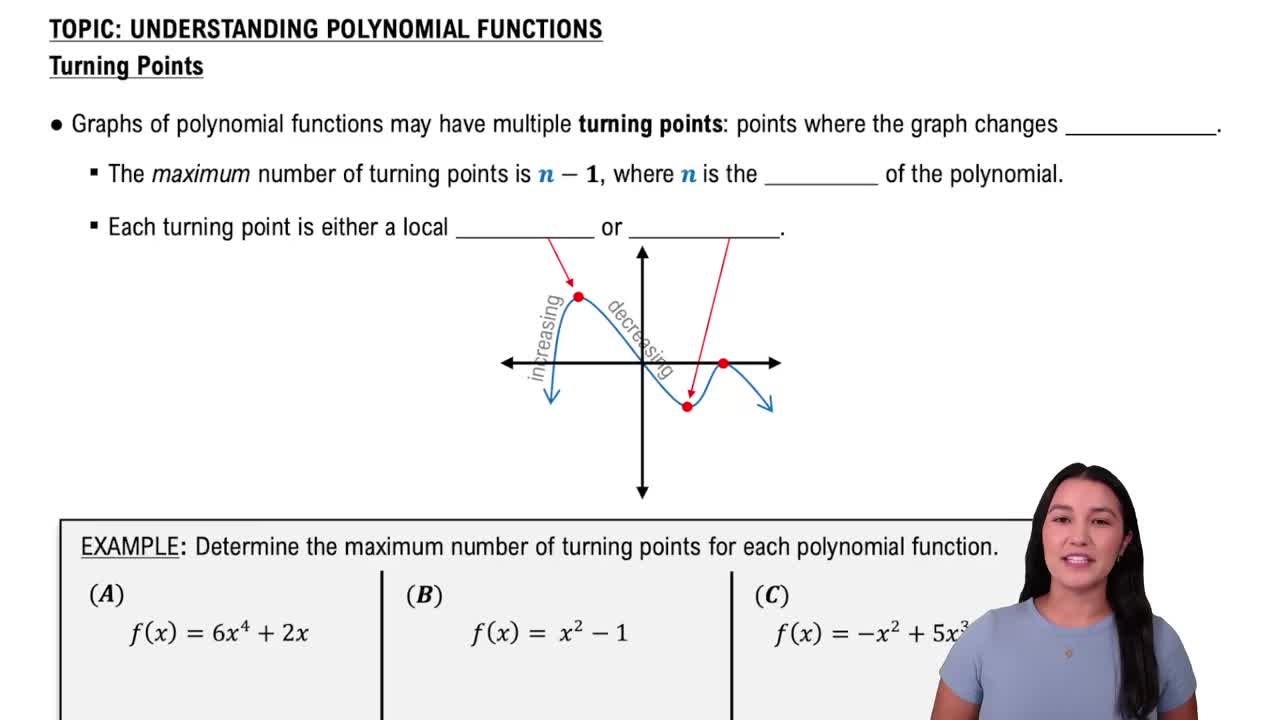
Use the Leading Coefficient Test to determine the end behavior of the graph of the polynomial function.
660
views

 Verified step by step guidance
 02:44
02:44
 4:30
4:30 05:28
05:28Use the Leading Coefficient Test to determine the end behavior of the graph of the polynomial function.
Use the graph of the rational function in the figure shown to complete each statement in Exercises 15–20.
As _____
Solve each polynomial inequality in Exercises 1–42 and graph the solution set on a real number line. Express each solution set in interval notation.
In Exercises 17–24, a) List all possible rational roots. b) List all possible rational roots. c) Use the quotient from part (b) to find the remaining roots and solve the equation. 6x3+25x2−24x+5=0
In Exercises 19–24, (a) Use the Leading Coefficient Test to determine the graph's end behavior. (b) Determine whether the graph has y-axis symmetry, origin symmetry, or neither. (c) Graph the function.
Use the Leading Coefficient Test to determine the end behavior of the graph of the polynomial function.