2. Graphs of Equations
Lines
Problem 39b
Textbook Question
Find the slope and y-intercept of each line, and graph it. 4y = -3x
 Verified step by step guidance
1
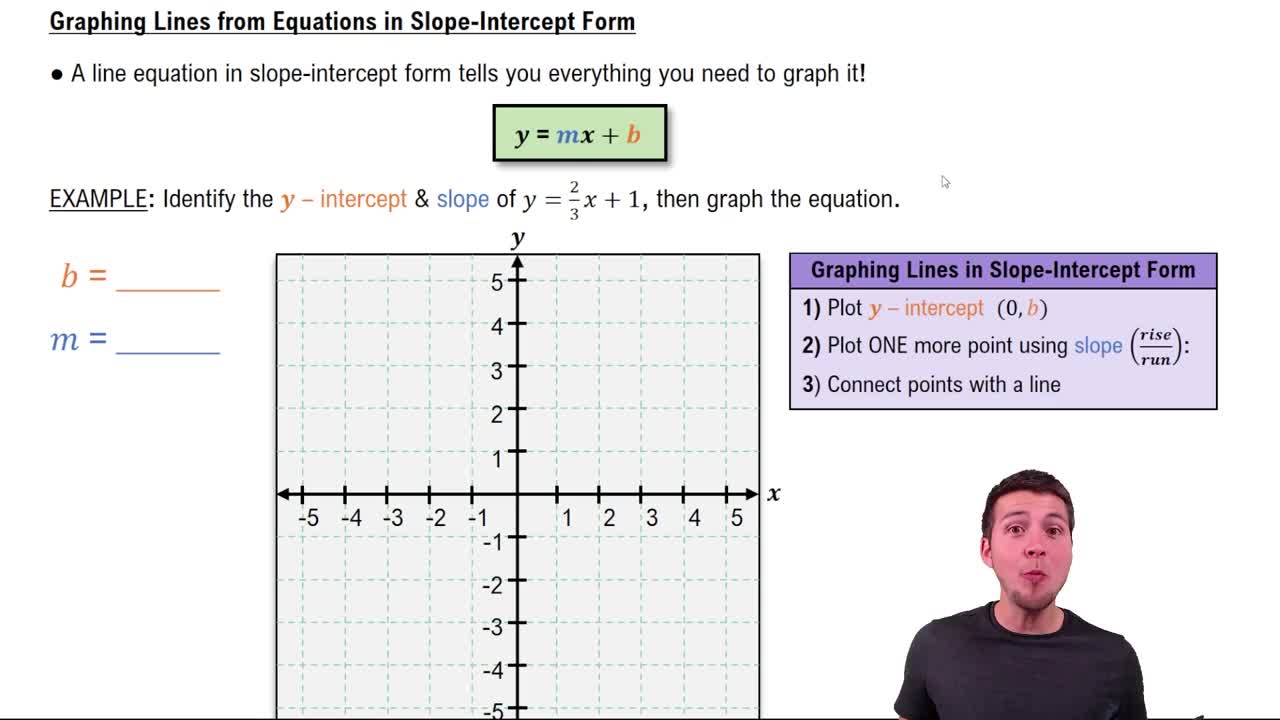
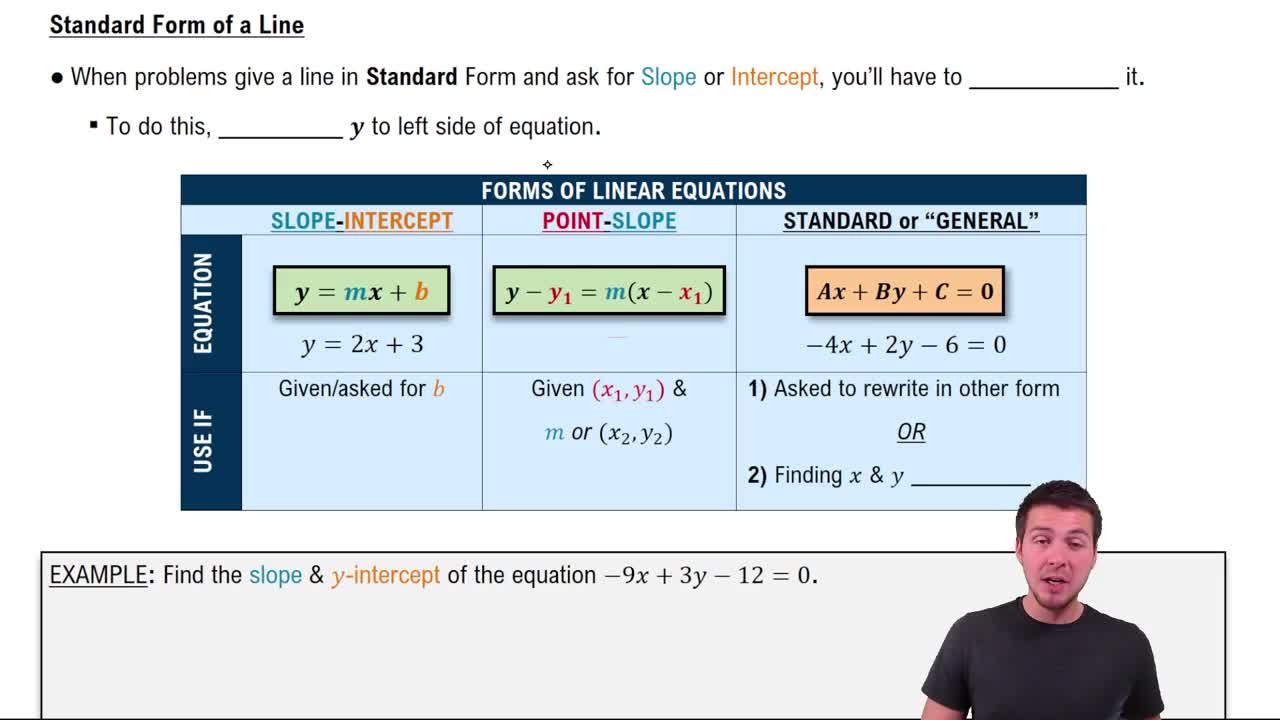
Step 1: The first step is to rewrite the equation in the slope-intercept form, which is y = mx + b, where m is the slope and b is the y-intercept. To do this, divide every term in the equation by 4 to isolate y. The equation becomes y = -3/4x + 0.
Step 2: Now that the equation is in slope-intercept form, we can identify the slope and the y-intercept. The slope (m) is the coefficient of x, which is -3/4. This means that for every 1 unit increase in x, y decreases by 3/4 units.
Step 3: The y-intercept (b) is the constant term, which is 0 in this case. This means that the line crosses the y-axis at the point (0,0).
Step 4: To graph the line, start by plotting the y-intercept on the y-axis. Since the y-intercept is 0, put a point at the origin (0,0).
Step 5: From the y-intercept, use the slope to find the next point. Since the slope is -3/4, go down 3 units and to the right 4 units from the y-intercept and put another point. Draw a line through these two points to complete the graph.
Recommended similar problem, with video answer:
Verified SolutionThis video solution was recommended by our tutors as helpful for the problem above
Video duration:
2mWas this helpful?
Key Concepts
Here are the essential concepts you must grasp in order to answer the question correctly.
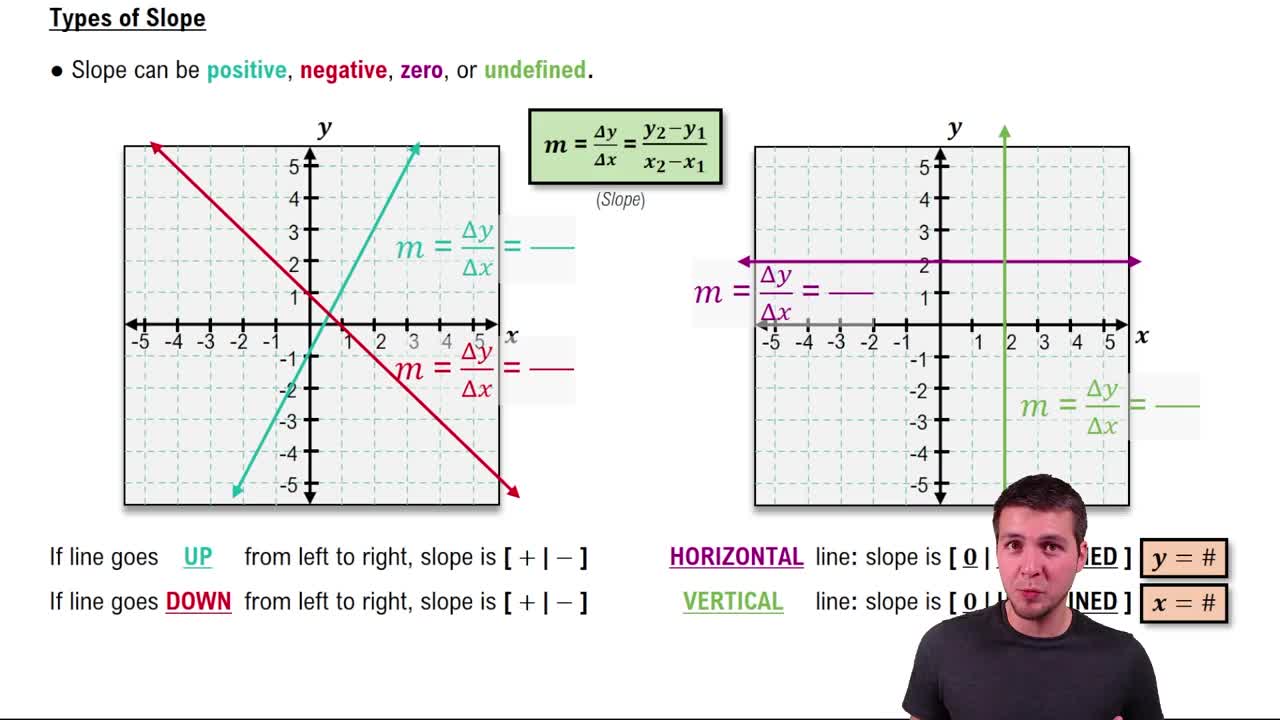
Slope
The slope of a line measures its steepness and direction, represented as 'm' in the slope-intercept form of a linear equation, y = mx + b. It is calculated as the ratio of the change in y to the change in x (rise over run). A positive slope indicates the line rises from left to right, while a negative slope indicates it falls.
Recommended video:
Guided course
 05:17
05:17Types of Slope
Y-Intercept
The y-intercept is the point where a line crosses the y-axis, represented as 'b' in the slope-intercept form of a linear equation. It can be found by setting x to zero in the equation of the line. This value is crucial for graphing the line, as it provides a starting point on the y-axis.
Recommended video:
Guided course
 04:08
04:08Graphing Intercepts
Graphing Linear Equations
Graphing linear equations involves plotting points that satisfy the equation on a coordinate plane. Once the slope and y-intercept are determined, the line can be drawn by starting at the y-intercept and using the slope to find additional points. This visual representation helps in understanding the relationship between the variables in the equation.
Recommended video:
 06:00
06:00Categorizing Linear Equations
 6:49m
6:49mWatch next
Master The Slope of a Line with a bite sized video explanation from Patrick Ford
Start learningRelated Videos
Related Practice