7. Systems of Equations & Matrices
Graphing Systems of Inequalities
Problem 51a
Textbook Question
Graph the solution set of each system of inequalities.
y ≥ x^2 + 4x + 4
y < -x^2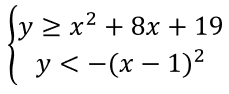
 Verified step by step guidance
1
Step 1: Identify and rewrite the inequalities in a more familiar form. The first inequality is already in standard quadratic form: y ≥ x^2 + 8x + 19. The second inequality can be rewritten as y < -(x - 1)^2.
Step 2: Determine the vertex and direction of the parabolas. For y ≥ x^2 + 8x + 19, complete the square to find the vertex. For y < -(x - 1)^2, recognize that it is a downward-opening parabola with vertex at (1, 0).
Step 3: Graph the first inequality y ≥ x^2 + 8x + 19. Start by plotting the vertex and a few points around it, then shade the region above the parabola since y is greater than or equal to the quadratic expression.
Step 4: Graph the second inequality y < -(x - 1)^2. Plot the vertex at (1, 0) and a few points around it, then shade the region below the parabola since y is less than the quadratic expression.
Step 5: Identify the overlapping region of the two shaded areas. This overlapping region represents the solution set for the system of inequalities.
Recommended similar problem, with video answer:
Verified SolutionThis video solution was recommended by our tutors as helpful for the problem above
Video duration:
16mWas this helpful?
Key Concepts
Here are the essential concepts you must grasp in order to answer the question correctly.
Graphing Inequalities
Graphing inequalities involves representing the solutions of an inequality on a coordinate plane. For linear inequalities, the boundary line is drawn as a solid line if the inequality includes equality (≥ or ≤) and as a dashed line if it does not (>, <). The region that satisfies the inequality is then shaded, indicating all the points that are solutions to the inequality.
Recommended video:
Guided course

 7:02
7:02Linear Inequalities
Quadratic Functions
Quadratic functions are polynomial functions of degree two, typically expressed in the form y = ax² + bx + c. The graph of a quadratic function is a parabola, which can open upwards or downwards depending on the sign of 'a'. Understanding the vertex, axis of symmetry, and intercepts of the parabola is crucial for accurately graphing inequalities involving quadratic functions.
Recommended video:
 06:36
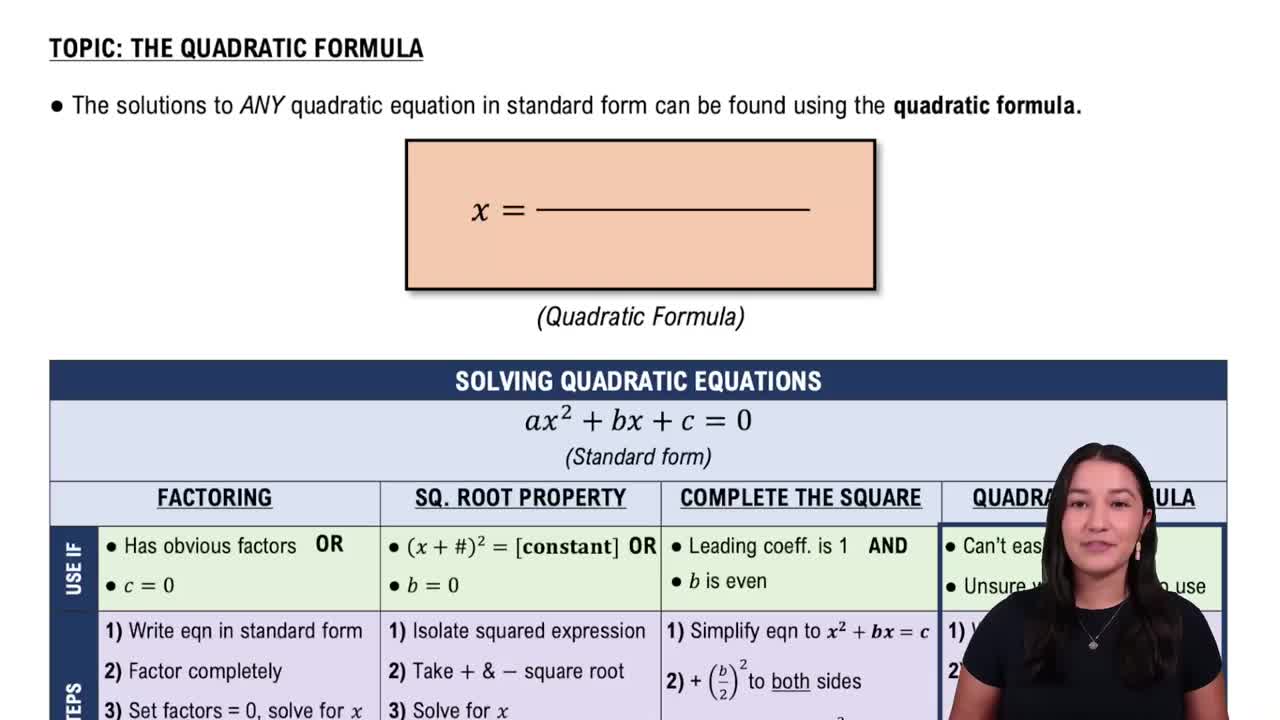
06:36Solving Quadratic Equations Using The Quadratic Formula
System of Inequalities
A system of inequalities consists of two or more inequalities that are considered simultaneously. The solution set is the region where the shaded areas of all inequalities overlap on the graph. To solve a system of inequalities, one must graph each inequality and identify the common region that satisfies all conditions, which can involve both linear and non-linear inequalities.
Recommended video:
Guided course
 6:19
6:19Systems of Inequalities
 7:2m
7:2mWatch next
Master Linear Inequalities with a bite sized video explanation from Patrick Ford
Start learning


