4. Polynomial Functions
Quadratic Functions
Problem 31
Textbook Question
In Exercises 17–38, use the vertex and intercepts to sketch the graph of each quadratic function. Give the equation of the parabola's axis of symmetry. Use the graph to determine the function's domain and range. f(x)=2x−x^2+3
 Verified step by step guidance
1
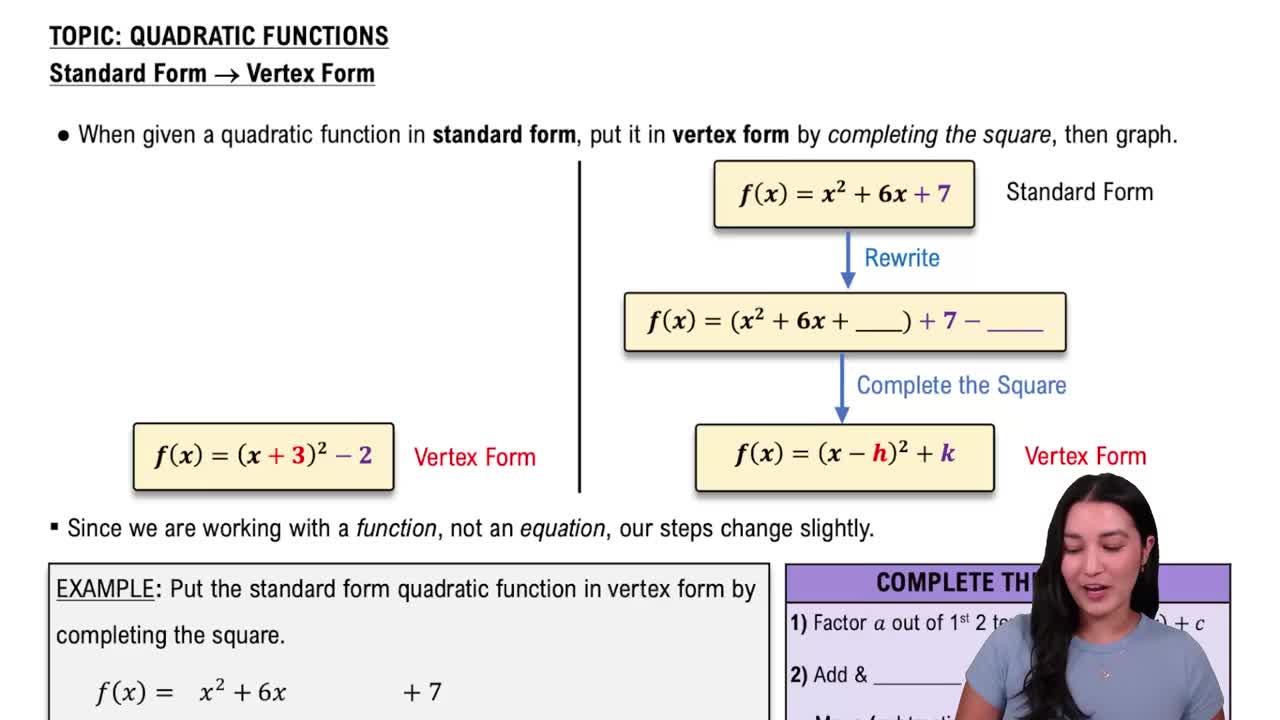
<insert step 1: Identify the standard form of the quadratic function. The given function is f(x) = -x^2 + 2x + 3. Rewrite it in the standard form, which is f(x) = ax^2 + bx + c. Here, a = -1, b = 2, and c = 3.>
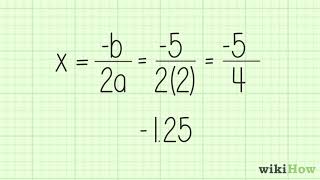
<insert step 2: Find the vertex of the parabola. The x-coordinate of the vertex can be found using the formula x = -b/(2a). Substitute the values of b and a into the formula to find the x-coordinate of the vertex.>
<insert step 3: Calculate the y-coordinate of the vertex by substituting the x-coordinate back into the original function f(x). This will give you the vertex (h, k) of the parabola.>
<insert step 4: Determine the axis of symmetry. The axis of symmetry is the vertical line that passes through the vertex. Its equation is x = h, where h is the x-coordinate of the vertex.>
<insert step 5: Identify the intercepts. Find the y-intercept by evaluating f(0). To find the x-intercepts, solve the equation f(x) = 0. Use these intercepts along with the vertex to sketch the graph of the parabola. Determine the domain and range from the graph.>
Recommended similar problem, with video answer:
Verified SolutionThis video solution was recommended by our tutors as helpful for the problem above
Video duration:
2mWas this helpful?
Key Concepts
Here are the essential concepts you must grasp in order to answer the question correctly.
Quadratic Functions
A quadratic function is a polynomial function of degree two, typically expressed in the form f(x) = ax^2 + bx + c. The graph of a quadratic function is a parabola, which can open upwards or downwards depending on the sign of the coefficient 'a'. Understanding the general shape and properties of parabolas is essential for sketching their graphs.
Recommended video:
 06:36
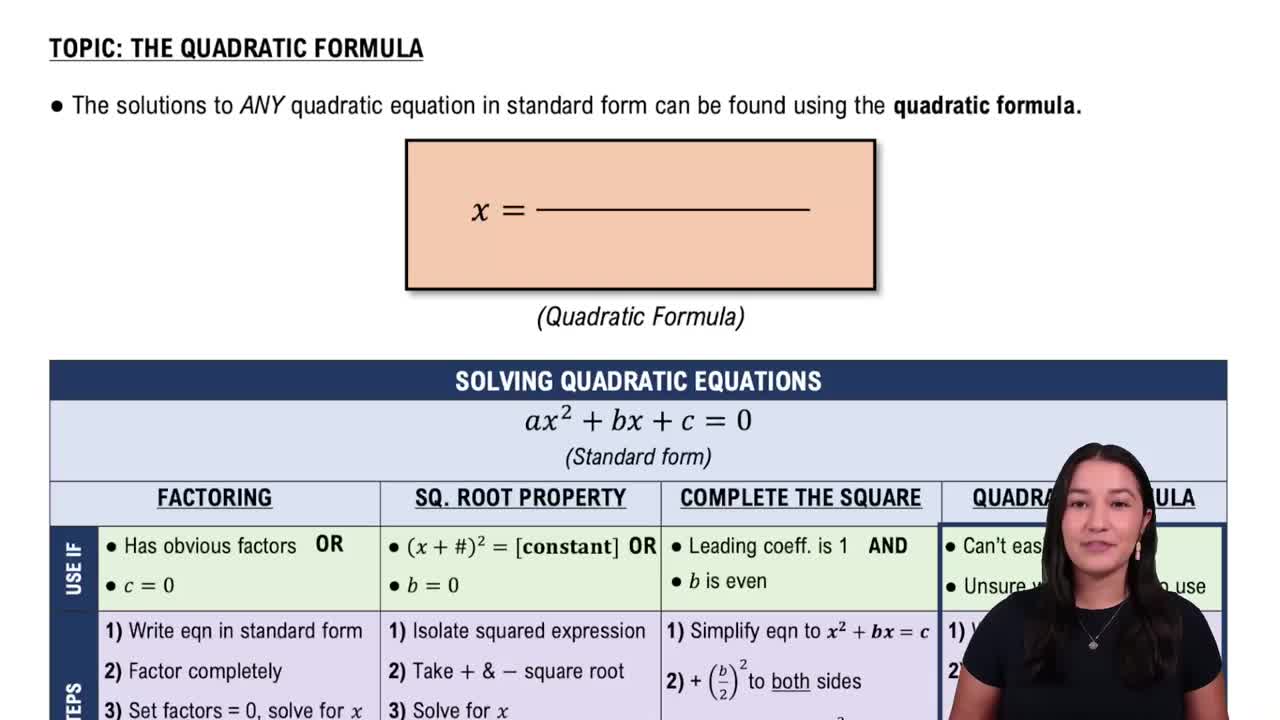
06:36Solving Quadratic Equations Using The Quadratic Formula
Vertex and Axis of Symmetry
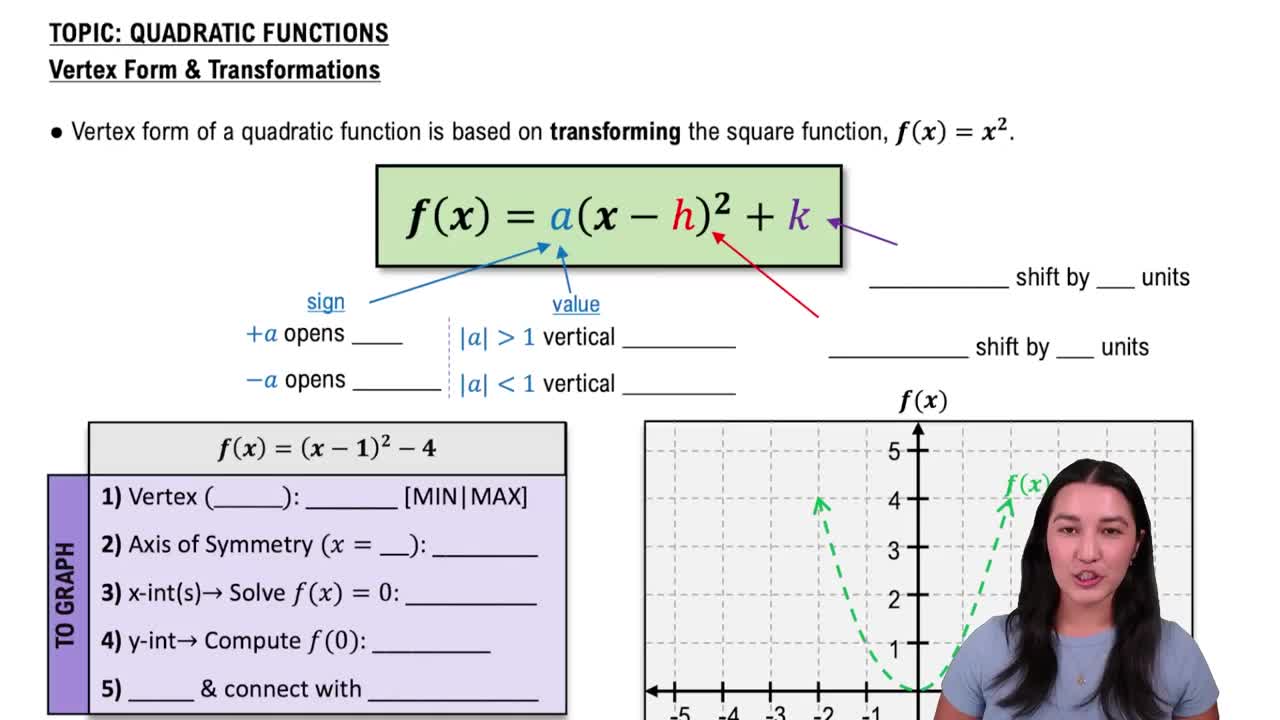
The vertex of a parabola is the highest or lowest point on the graph, depending on its orientation. The axis of symmetry is a vertical line that passes through the vertex, dividing the parabola into two mirror-image halves. For a quadratic function in standard form, the vertex can be found using the formula x = -b/(2a), and the axis of symmetry is given by the equation x = -b/(2a).
Recommended video:
 08:07
08:07Vertex Form
Domain and Range
The domain of a function refers to all possible input values (x-values) for which the function is defined, while the range refers to all possible output values (y-values). For quadratic functions, the domain is typically all real numbers, while the range depends on the vertex's position. If the parabola opens upwards, the range starts from the y-coordinate of the vertex to positive infinity; if it opens downwards, the range extends from negative infinity to the y-coordinate of the vertex.
Recommended video:
 4:22
4:22Domain & Range of Transformed Functions
 7:42m
7:42mWatch next
Master Properties of Parabolas with a bite sized video explanation from Callie
Start learningRelated Videos
Related Practice