3. Functions
Intro to Functions & Their Graphs
Problem 23c
Textbook Question
Graph each piecewise-defined function. See Example 2. ƒ(x)={4-x if x<2, 1+2x if x≥2
 Verified step by step guidance
1
Step 1: Identify the two pieces of the piecewise function: f(x) = x + 5 for x ≤ 3 and f(x) = 14 - 3x for x > 3.
Step 2: Graph the first piece, f(x) = x + 5, for x ≤ 3. This is a linear function with a slope of 1 and a y-intercept of 5. Plot points for x-values less than or equal to 3 and draw the line.
Step 3: Graph the second piece, f(x) = 14 - 3x, for x > 3. This is a linear function with a slope of -3 and a y-intercept of 14. Plot points for x-values greater than 3 and draw the line.
Step 4: Ensure continuity at x = 3 by checking the value of both pieces at x = 3. For f(x) = x + 5, when x = 3, f(3) = 8. For f(x) = 14 - 3x, when x = 3, f(3) = 5. Since the values are different, there is a jump discontinuity at x = 3.
Step 5: Combine the two pieces on the same graph, clearly indicating the different domains for each piece and the discontinuity at x = 3.
Recommended similar problem, with video answer:
Verified SolutionThis video solution was recommended by our tutors as helpful for the problem above
Video duration:
5mWas this helpful?
Key Concepts
Here are the essential concepts you must grasp in order to answer the question correctly.
Piecewise Functions
A piecewise function is defined by different expressions based on the input value. Each segment of the function applies to a specific interval of the domain, allowing for varied behavior in different regions. Understanding how to interpret and graph these functions is crucial, as it involves determining which expression to use based on the value of x.
Recommended video:

 4:56
4:56Function Composition
Graphing Techniques
Graphing piecewise functions requires plotting each segment separately according to its defined conditions. This involves identifying the endpoints of each interval and determining whether they are included (closed dot) or excluded (open dot) in the graph. Mastery of these techniques is essential for accurately representing the function visually.
Recommended video:
Guided course
 02:16
02:16Graphs and Coordinates - Example
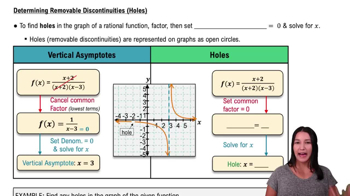
Continuity and Discontinuity
Continuity refers to whether a function has any breaks, jumps, or holes in its graph. For piecewise functions, it is important to check the transition points where the definition changes, as these points can indicate discontinuities. Understanding continuity helps in analyzing the overall behavior of the function and ensuring accurate graphing.
Recommended video:
 3:34
3:34Determining Removable Discontinuities (Holes)
 5:2m
5:2mWatch next
Master Relations and Functions with a bite sized video explanation from Nick Kaneko
Start learningRelated Videos
Related Practice


