In Exercises 39–40, graph f and g in the same rectangular coordinate system. Use transformations of the graph of f to obtain the graph of g. Graph and give equations of all asymptotes. Use the graphs to determine each function's domain and range. f(x) = ln x and g(x) = - ln (2x)
Verified step by step guidance
1
Step 1: Begin by analyzing the given functions f(x) = ln(x) and g(x) = -ln(2x). The function f(x) = ln(x) is the natural logarithm function, which has a vertical asymptote at x = 0 and is defined for x > 0. The function g(x) = -ln(2x) involves a reflection across the x-axis and a horizontal compression by a factor of 2.
Step 2: Identify the transformations applied to f(x) to obtain g(x). The negative sign in g(x) = -ln(2x) reflects the graph of f(x) across the x-axis, and the factor of 2 inside the logarithm compresses the graph horizontally. This means that for g(x), the x-values are scaled by a factor of 1/2 compared to f(x).
Step 3: Determine the asymptotes for both functions. For f(x) = ln(x), the vertical asymptote is at x = 0 because the natural logarithm is undefined for x ≤ 0. Similarly, g(x) = -ln(2x) also has a vertical asymptote at x = 0, as the argument of the logarithm (2x) must be positive.
Step 4: Use the graphs to determine the domain and range of each function. For f(x) = ln(x), the domain is (0, ∞) and the range is (-∞, ∞). For g(x) = -ln(2x), the domain is also (0, ∞), but the range is (-∞, ∞) due to the reflection across the x-axis.
Step 5: Plot key points to verify the transformations. For f(x), key points include (1, 0) and (e, 1). For g(x), the corresponding points after transformation are (0.5, 0) and (e/2, -1). These points confirm the horizontal compression and reflection applied to f(x) to obtain g(x).
Verified video answer for a similar problem:
This video solution was recommended by our tutors as helpful for the problem above
Video duration:
15m
Play a video:
0 Comments
Key Concepts
Here are the essential concepts you must grasp in order to answer the question correctly.
Logarithmic Functions
Logarithmic functions, such as f(x) = ln(x), are the inverses of exponential functions. They are defined for positive real numbers and have a vertical asymptote at x = 0. Understanding their properties, including their domain, range, and behavior as x approaches the asymptote, is crucial for graphing and analyzing transformations.
Transformations involve shifting, reflecting, stretching, or compressing the graph of a function. For example, g(x) = -ln(2x) represents a vertical reflection of f(x) = ln(x) and a horizontal compression. Recognizing how these transformations affect the graph helps in visualizing and deriving the new function's characteristics from the original.
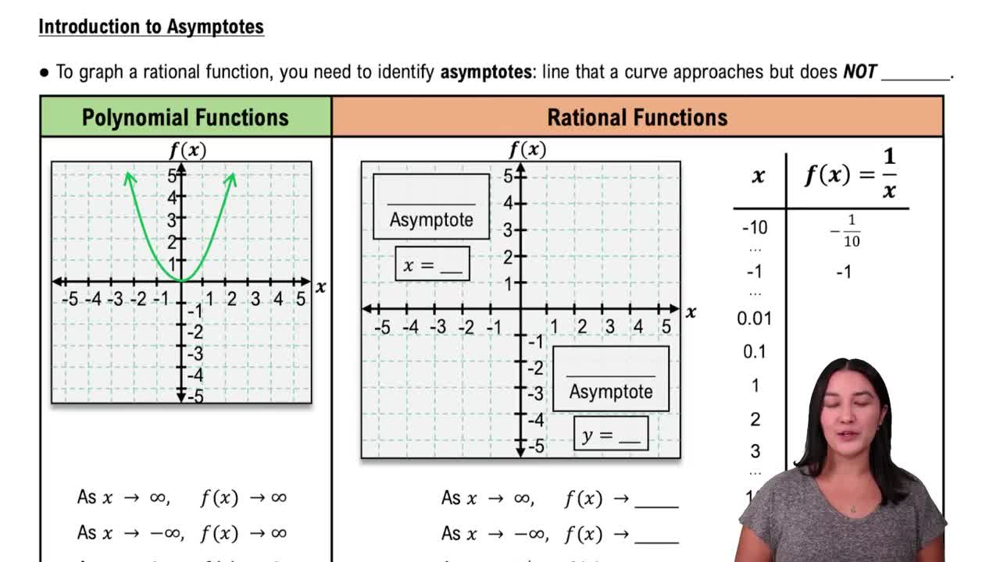
Asymptotes are lines that a graph approaches but never touches. For logarithmic functions, vertical asymptotes occur where the function is undefined, such as at x = 0 for f(x) = ln(x). Identifying asymptotes is essential for understanding the behavior of the function at its boundaries and for determining the domain and range of the functions involved.


 Verified step by step guidance
 5:26
5:26