Textbook QuestionIn Exercises 1-16, use the graph of y = f(x) to graph each function g. g(x) = f(x)+1271views
Textbook QuestionIn Exercises 1-16, use the graph of y = f(x) to graph each function g. g(x) = f(x+1)516views
Textbook QuestionIn Exercises 1-16, use the graph of y = f(x) to graph each function g. g(x) = f(-x)236views
Textbook QuestionIn Exercises 1-16, use the graph of y = f(x) to graph each function g. g(x) = -f(x) +3226views
Textbook QuestionIn Exercises 1-16, use the graph of y = f(x) to graph each function g. g(x) = f(-x)+3365views
Textbook QuestionIn Exercises 1-16, use the graph of y = f(x) to graph each function g. g(x) = 2f(x)273views
Textbook QuestionIn Exercises 1-16, use the graph of y = f(x) to graph each function g. g(x) = f(x/2)227views
Textbook QuestionIn Exercises 1-16, use the graph of y = f(x) to graph each function g. g(x) = -f(2x) - 1250views
Textbook QuestionIn Exercises 17-32, use the graph of y = f(x) to graph each function g. g(x) = f(x) - 1253views
Textbook QuestionIn Exercises 17-32, use the graph of y = f(x) to graph each function g. g(x) = f(x-1)233views
Textbook QuestionIn Exercises 17-32, use the graph of y = f(x) to graph each function g. g(x) = f(x-1)+2343views
Textbook QuestionIn Exercises 17-32, use the graph of y = f(x) to graph each function g. g(x) = f(x + 1) − 2200views
Textbook QuestionIn Exercises 17-32, use the graph of y = f(x) to graph each function g. g(x) = f(-x)236views
Textbook QuestionIn Exercises 17-32, use the graph of y = f(x) to graph each function g. g(x) = f(-x)+1274views
Textbook QuestionIn Exercises 17-32, use the graph of y = f(x) to graph each function g. g(x) = -f(x)+1205views
Textbook QuestionIn Exercises 17-32, use the graph of y = f(x) to graph each function g. g(x) = ½ f(x)213views
Textbook QuestionIn Exercises 33-44, use the graph of y = f(x) to graph each function g. g(x) = f(x)+2274views
Textbook QuestionIn Exercises 33-44, use the graph of y = f(x) to graph each function g. g(x) = f(x+2)207views
Textbook QuestionPlot each point, and then plot the points that are symmetric to the given point with respect to the (a) x-axis, (b) y-axis, and (c) origin. (5, -3)265views
Textbook QuestionIn Exercises 33-44, use the graph of y = f(x) to graph each function g. g(x) = -(1/2)f(x+2)213views
Textbook QuestionPlot each point, and then plot the points that are symmetric to the given point with respect to the (a) x-axis, (b) y-axis, and (c) origin. (-4, -2)206views
Textbook QuestionIn Exercises 33-44, use the graph of y = f(x) to graph each function g. g(x) = -½ ƒ ( x + 2) —2220views
Textbook QuestionIn Exercises 33-44, use the graph of y = f(x) to graph each function g. g(x) = (1/2)f(2x)243views
Textbook QuestionWithout graphing, determine whether each equation has a graph that is symmetric with respect to the x-axis, the y-axis, the origin, or none of these. See Examples 3 and 4. y=x^2+51078views
Textbook QuestionIn Exercises 45-52, use the graph of y = f(x) to graph each function g. g(x) = -f(x-1) + 1256views
Textbook QuestionWithout graphing, determine whether each equation has a graph that is symmetric with respect to the x-axis, the y-axis, the origin, or none of these. See Examples 3 and 4. x^2+y^2=12427views
Textbook QuestionIn Exercises 45-52, use the graph of y = f(x) to graph each function g. g(x) = -f(x + 1) − 1251views
Textbook QuestionIn Exercises 45-52, use the graph of y = f(x) to graph each function g. g(x)=2f(x-1)314views
Textbook QuestionIn Exercises 53-66, begin by graphing the standard quadratic function, f(x) = x². Then use transformations of this graph to graph the given function. g(x) = x² - 2319views
Textbook QuestionIn Exercises 53-66, begin by graphing the standard quadratic function, f(x) = x². Then use transformations of this graph to graph the given function. g(x) = (x − 2)²244views
Textbook QuestionIn Exercises 55–59, use the graph of to graph each function g. g(x) = f(x + 2) + 3241views
Textbook QuestionIn Exercises 55–59, use the graph of to graph each function g. g(x) = -f(2x)253views
Textbook QuestionIn Exercises 60–63, begin by graphing the standard quadratic function, f(x) = x^2. Then use transformations of this graph to graph the given function. g(x) = x^2 + 2258views
Textbook QuestionIn Exercises 60–63, begin by graphing the standard quadratic function, f(x) = x^2. Then use transformations of this graph to graph the given function. r(x) = -(x + 1)^2246views
Textbook QuestionIn Exercises 53-66, begin by graphing the standard quadratic function, f(x) = x². Then use transformations of this graph to graph the given function. g(x) = (1/2)(x − 1)²245views
Textbook QuestionIn Exercises 64–66, begin by graphing the square root function, f(x) = √x. Then use transformations of this graph to graph the given function. g(x) = √(x + 3)211views
Textbook QuestionIn Exercises 53-66, begin by graphing the standard quadratic function, f(x) = x². Then use transformations of this graph to graph the given function. h(x) = (1/2) (x − 1)² – 1393views
Textbook QuestionIn Exercises 64–66, begin by graphing the square root function, f(x) = √x. Then use transformations of this graph to graph the given function. r(x) = 2√(x + 2)708views
Textbook QuestionIn Exercises 53-66, begin by graphing the standard quadratic function, f(x) = x². Then use transformations of this graph to graph the given function. h(x) = -2(x+2)²+1209views
Textbook QuestionGraph each function. See Examples 6–8 and the Summary of Graphing Techniques box following Example 9. ƒ(x)=x^2+2186views
Textbook QuestionIn Exercises 67-80, begin by graphing the square root function, f(x) = √x. Then use transformations of this graph to graph the given function. g(x) = √x + 1226views
Textbook QuestionIn Exercises 67-80, begin by graphing the square root function, f(x) = √x. Then use transformations of this graph to graph the given function. g(x) = √(x+1)227views
Textbook QuestionIn Exercises 67-80, begin by graphing the square root function, f(x) = √x. Then use transformations of this graph to graph the given function. h(x)=-√(x + 1)256views
Textbook QuestionConsider the following nonlinear system. Work Exercises 75 –80 in order. y = | x - 1 | y = x^2 - 4 How is the graph of y = | x - 1 | obtained by transforming the graph of y = | x |?204views
Textbook QuestionGraph each function. See Examples 6–8 and the Summary of Graphing Techniques box following Example 9. h(x)=-(x+1)^3178views
Textbook QuestionIn Exercises 67-80, begin by graphing the square root function, f(x) = √x. Then use transformations of this graph to graph the given function. h(x) = √(x+1)-1243views
Textbook QuestionIn Exercises 67-80, begin by graphing the square root function, f(x) = √x. Then use transformations of this graph to graph the given function. g(x) = 2√(x+1)-1205views
Textbook QuestionGraph each function. See Examples 6–8 and the Summary of Graphing Techniques box following Example 9. ƒ(x)=-3(x-2)^2+1185views
Textbook QuestionIn Exercises 81–94, begin by graphing the absolute value function, f(x) = |x|. Then use transformations of this graph to graph the given function. g(x) = |x|+3234views
Textbook QuestionIn Exercises 81–94, begin by graphing the absolute value function, f(x) = |x|. Then use transformations of this graph to graph the given function. g(x) = |x+3|239views
Textbook QuestionGraph each function. See Examples 6–8 and the Summary of Graphing Techniques box following Example 9. ƒ(x)=2√x+1205views
Textbook QuestionIn Exercises 81–94, begin by graphing the absolute value function, f(x) = |x|. Then use transformations of this graph to graph the given function. h(x) = |x + 3| - 2236views
Textbook QuestionGraph each function. See Examples 6–8 and the Summary of Graphing Techniques box following Example 9. ƒ(x)=3√x-2225views
Textbook QuestionIn Exercises 81–94, begin by graphing the absolute value function, f(x) = |x|. Then use transformations of this graph to graph the given function. h(x) = 2|x+3|230views
Textbook QuestionIn Exercises 81–94, begin by graphing the absolute value function, f(x) = |x|. Then use transformations of this graph to graph the given function. g(x) = -2|x+3|+2197views
Textbook QuestionEach of the following graphs is obtained from the graph of ƒ(x)=|x| or g(x)=√x by applying several of the transformations discussed in this section. Describe the transformations and give an equation for the graph. 218views
Textbook QuestionIn Exercises 95-106, begin by graphing the standard cubic function, f(x) = x³. Then use transformations of this graph to graph the given function. g(x) = x³-3213views
Textbook QuestionDescribe how the graph of each function can be obtained from the graph of ƒ(x) = |x|. g(x) = -|x|690views
Textbook QuestionIn Exercises 95-106, begin by graphing the standard cubic function, f(x) = x³. Then use transformations of this graph to graph the given function. g(x) = (x − 3)^3260views
Textbook QuestionLet ƒ(x) = 3x -4. Find an equation for each reflection of the graph of ƒ(x). across the x-axis350views
Textbook QuestionIn Exercises 95-106, begin by graphing the standard cubic function, f(x) = x³. Then use transformations of this graph to graph the given function. h(x) = -x³211views
Textbook QuestionLet ƒ(x) = 3x -4. Find an equation for each reflection of the graph of ƒ(x). across the y-axis197views
Textbook QuestionEach of the following graphs is obtained from the graph of ƒ(x)=|x| or g(x)=√x by applying several of the transformations discussed in this section. Describe the transformations and give an equation for the graph. 244views
Textbook QuestionThe graph of a function ƒ is shown in the figure. Sketch the graph of each function defined as follows. (a) y = ƒ(x) +3219views
Textbook QuestionThe graph of a function ƒ is shown in the figure. Sketch the graph of each function defined as follows. (b) y = ƒ(x-2)242views
Textbook QuestionThe graph of a function ƒ is shown in the figure. Sketch the graph of each function defined as follows. (c) y = ƒ(x+3) - 2365views
Textbook QuestionIn Exercises 95-106, begin by graphing the standard cubic function, f(x) = x³. Then use transformations of this graph to graph the given function. r(x) = (x − 2)³ +1211views
Textbook QuestionThe graph of a function ƒ is shown in the figure. Sketch the graph of each function defined as follows. (d) y = |ƒ(x)|328views
Textbook QuestionIn Exercises 107-118, begin by graphing the cube root function, f(x) = ∛x. Then use transformations of this graph to graph the given function. g(x) = ∛x+2421views
Textbook QuestionIn Exercises 107-118, begin by graphing the cube root function, f(x) = ∛x. Then use transformations of this graph to graph the given function. g(x) = ∛(x-2)736views
Textbook QuestionIn Exercises 107-118, begin by graphing the cube root function, f(x) = ∛x. Then use transformations of this graph to graph the given function. g(x) = (1/2)∛(x-2)214views
Textbook QuestionIn Exercises 107-118, begin by graphing the cube root function, f(x) = ∛x. Then use transformations of this graph to graph the given function. g(x) = (1/2)∛(x+2) - 2295views
Textbook QuestionIn Exercises 107-118, begin by graphing the cube root function, f(x) = ∛x. Then use transformations of this graph to graph the given function. ∛(-x-2)341views
Textbook QuestionIn Exercises 81–94, begin by graphing the absolute value function, f(x) = |x|. Then use transformations of this graph to graph the given function. g(x) = -|x + 4| +2400views
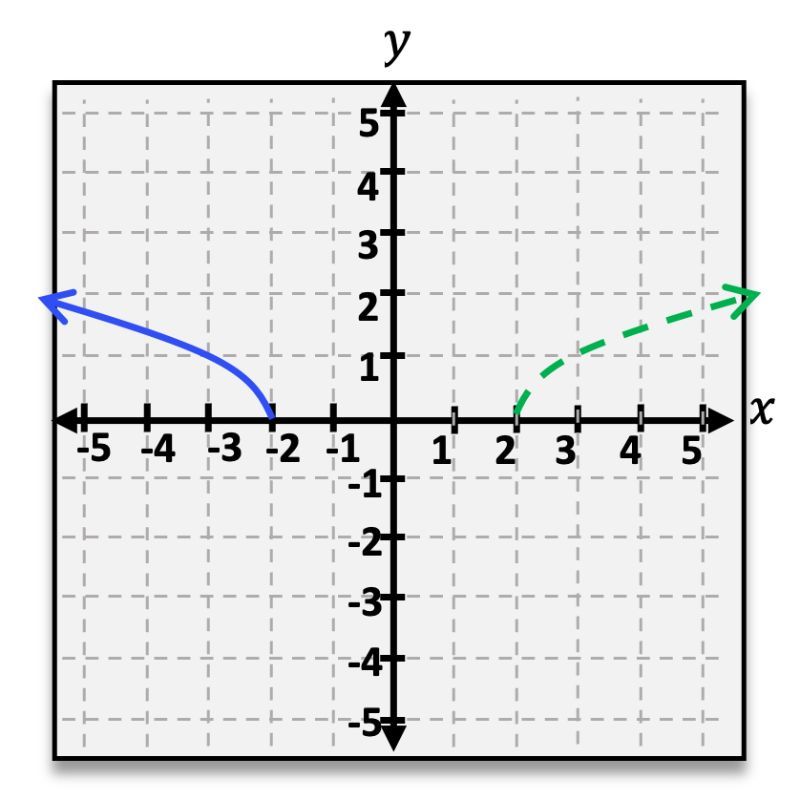
Multiple ChoiceThe green dotted line in the graph below represents the function f(x)f\left(x\right)f(x). The blue solid line represents the function g(x)g\left(x\right)g(x), which is the function f(x)f\left(x\right)f(x) after it has gone through a shift transformation. Find the equation for g(x)g\left(x\right)g(x).358views3rank
Multiple ChoiceThe green dotted curve below is a graph of the function f(x)f\left(x\right)f(x). Find the domain and range of g(x)g\left(x\right)g(x) (the blue solid curve), which is a transformation of f(x)f\left(x\right)f(x).494views4rank

 5:25m
5:25m